

Join our webinars: Getting started with Datawrapper, and a Maps Deep Dive
June 20th, 2023
3 min

We’re excited to introduce the newest face around here: John McCall is joining us on the customer support and success team. He’ll be working with Elana, Aya, and Margaux to answer all your questions and help you get the most out of Datawrapper.
We asked John a few questions to get to know him better:
Hi, I’m John (he/him/his). I’m from the U.S., but have been living in Germany since 2018. I love exploring and have lived in many different places, including New Jersey, Colorado, California, and North & South Carolina in the U.S., and Lüneburg, Bonn, Munich, Vienna, Dresden, and Berlin in the German-speaking world. I am interested in history, geography, geopolitics, and philosophy and love reading about those topics. I’m a generally very curious person and seek knowledge and truth. I also like to get out into nature when possible, going on hikes or taking a day at the lake. But when it’s cold, I’d prefer to stay in and watch TV (Drag Race or NBA) or movies (comedy or sci-fi/fantasy), find music (house, disco, boogie), read, or play games.

I completed a master’s degree in the field of cartography at the Technical Universities of Munich, Vienna, and Dresden (thesis through Munich). Before that, I lived in San Francisco working in both nonprofit and tech.
During my master’s degree in 2019, I wanted to do an internship in the summer and I found Datawrapper by searching for data vis companies in Berlin. As someone interested in maps, I understand how difficult it can be to make choropleth or symbol maps if you don’t know where to start. I love that Datawrapper empowers people without technical or design backgrounds to make good looking ones. I found Datawrapper’s mission and product inspiring and knew I wanted to work with them. I had such a great time interning that summer that when I finished the degree, I was eager to see if they were hiring again. They were.
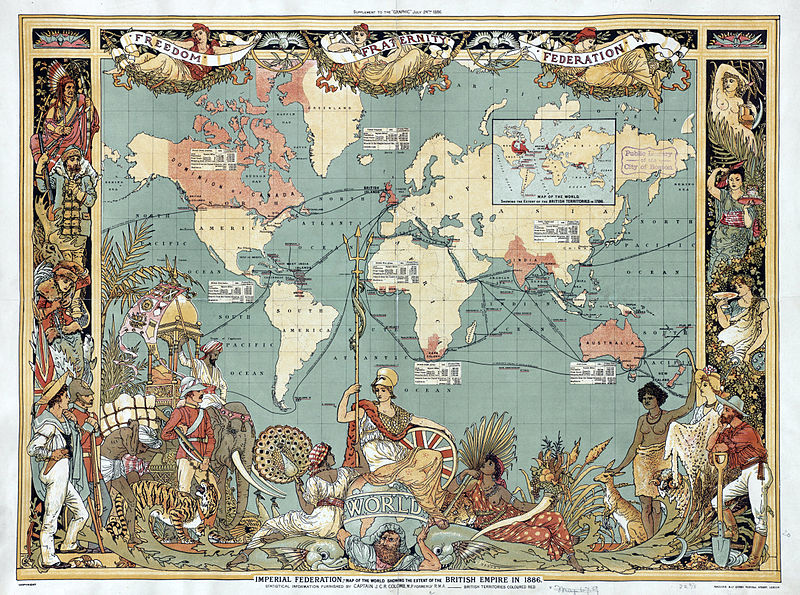
I got interested in data vis through the field of history, actually. I studied history in university, particularly European colonial history, and so was exposed to many choropleth maps that depicted European colonization.
Since then, I have maintained an interest in historical and thematic mapping, and I’ve expanded my interest into other forms of data visualizations too. But my passion will always be maps.
I like the Weekly Chart articles I did here when I was an intern. This is a cartogram — a map on which statistical information is shown in diagrammatic form — of the San Francisco Bay Area, showing the populations of all incorporated cities and towns by the size of the squares, and the counties by their colors.
I think there’s a lot of room for exploration about how we can show data on maps, both with the data we choose to represent and with how we represent it. I’m excited to keep learning about that from the creative minds at Datawrapper and to make some cool visualizations.
I will be doing all things client-facing — product demonstrations, customer success, and customer support. I’ll help you acquire the product, get you set up and trained with it, and then answer any questions you may have about it! One of Datawrapper’s greatest strengths is its friendly and responsive support team, and I’m excited to be a part of it.
Welcome, John! It’s great to have you back.


Comments