Join our webinar to learn more about Datawrapper maps
June 12th, 2023
2 min
Datawrapper lets you show your data as beautiful charts, maps or tables with a few clicks. Find out more about all the available visualization types.
Our mission is to help everyone communicate with data - from newsrooms to global enterprises, non-profits or public service.
We want to enable everyone to create beautiful charts, maps, and tables. New to data visualization? Or do you have specific questions about us? You'll find all the answers here.
Data vis best practices, news, and examples
250+ articles that explain how to use Datawrapper
Answers to common questions
An exchange place for Datawrapper visualizations
Attend and watch how to use Datawrapper best
Learn about available positions on our team
Our latest small and big improvements
Build your integration with Datawrapper's API
Get in touch with us – we're happy to help
We’ve seen a lot of interest from you in our webinars – so much so that all available seats filled quickly after we opened registration. Thank you to everyone who has participated so far!
If you didn’t get a seat, we’re happy to announce that we’ll be repeating the following sessions:

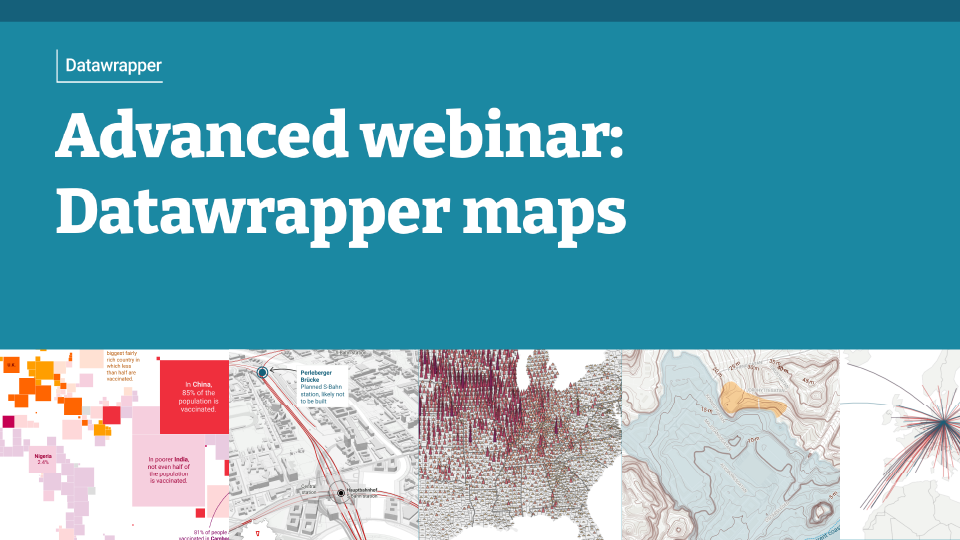
Are you already familiar with Datawrapper and interested in exploring its advanced features for creating maps? Our mapping webinar is for you!
Join me to learn about advanced mapping with Datawrapper on .
That’s 8 a.m. on the U.S. West Coast; 11 a.m. on the East Coast; 12 noon in Brazil and Argentina; 4 p.m. for readers in the U.K. and West Africa; 5 p.m. for most Europeans; and 8:30 p.m. in India. (All time zones in between are welcome too, of course!)
We’ll discuss the types of maps you can create with Datawrapper and learn advanced skills like uploading a custom basemap and customizing tooltips with HTML. You’ll have a chance to try your hand at some of those in real time. And I’ll point you towards resources for learning even more about Datawrapper maps on your own.

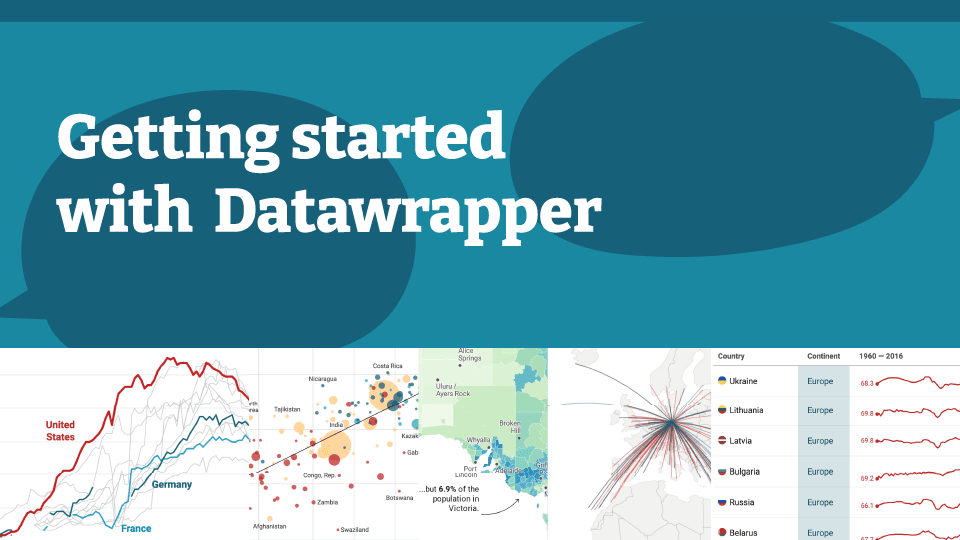
Just started using Datawrapper and wanting to get more out of it? Wondering whether it’s the right tool for your work, research, or personal projects? Or just curious to see how the whole thing works? We’re now offering a regular public webinar, and the next session is coming up soon!
Join me to learn about getting started with Datawrapper on .
That’s 8 a.m. on the U.S. West Coast; 11 a.m. on the East Coast; 12 noon in Brazil and Argentina; 4 p.m. for readers in the U.K. and West Africa; 5 p.m. for most Europeans; and 8:30 p.m. in India. (All time zones in between are welcome too, of course!)
We’ll discuss how Datawrapper works, what plans we offer, and what kinds of visualizations you can make with the tool. You’ll have a chance to try your hand at creating a chart and a map in real time. And I’ll point you towards more resources for getting the most out of Datawrapper going forward.
If you have any more questions, write them in the comments here or send them to guillermina@datawrapper.de. If you can’t make it this time, don’t worry — there will be more sessions to come as well. You can follow Datawrapper on Twitter or check our new website datawrapper.de/webinars to learn about future webinars. I’m looking forward to diving deeper into Datawrapper maps together!
Comments