

French people are losing confidence in the Paris Olympics
March 28th, 2024
3 min
This article is brought to you by Datawrapper, a data visualization tool for creating charts, maps, and tables. Learn more.
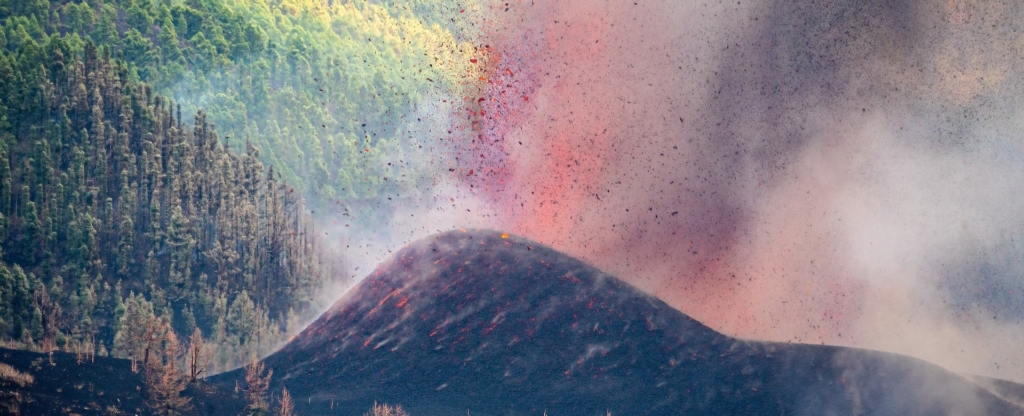
Hi, this is Anna. At Datawrapper, I’m responsible for the maps you can find in our choropleth and symbol map editor. This week, I’m going to take a closer look at ongoing eruption of the Cumbre Vieja volcano on La Palma.
People have kept settling around volcanoes throughout history, despite the risk of eruptions, because of their extremely fertile soil. Lava and ash have a high content of potassium, phosphorus, and calcium, and the cavities in the lava can also function as a water reserve. These are ideal conditions for many crops. But the fertile soil comes with a price: living close to an active volcano means that it can erupt at any time and cause death and damage. The initial consequences of an eruption are devastating, the lava flood destroys everything living in its way, and it takes years, sometimes decades, for plants to reestablish.
The banana plantations on La Palma are an example of the give and take of volcanoes. Thanks to the fertile volcanic soil combined with ideal weather conditions, bananas grow very well on the island. After tourism, bananas are the biggest economic sector in La Palma. But on the 19th of September, an earthquake occurred in the Cumbre Vieja mountains and the volcano Cabeza de Vaco started to erupt from seven individual vents. As a tragic consequence of the eruption, on many plantations the lava floods and falling ashes have destroyed the entire harvest for this year.
The polygons showing the extent of the lava flow on the map are published by Copernicus Emergency Management Service. Copernicus is the European satellite programme, and member states can request emergency support to provide geo-spatial information such as satellite imagery, polygons extracted from the imagery, and damage assessments of buildings and roads.
The Spanish General Directorate for Civil Protection and Emergencies requested EMS support for their emergency response on La Palma, and the first data set was published on September 21. Ideally, new data would be published every day, but some days clouds cover the island and it is not possible to get good quality imagery of the eruption.
To show a bit better which way the lava flows, I added a layer of high resolution hillshading to the locator map. The hillshading polygons are derived from the Spanish Centro de Descargas 2 meter resolution DTM (Digital Terrain Model) and uploaded as area markers.
That's it from me this week! If you have feedback or questions, leave it in the comments below. Next week Gregor will take care of the Weekly Chart — we’ll see you then!


Comments