Into the Death Zone

Hi! I’m Linus, a developer at the App team at Datawrapper. I recently read that Mount Everest is becoming like a graveyard because of the difficulty of removing bodies of climbers who die on it. The popularity of the mountain had me subconsciously think that Mount Everest is no longer a dangerous mountain to climb. Turns out I was wrong.
The Earth’s highest mountain, Mount Everest, has attracted climbers for a long time. The first successful recorded summit, by Tenzing Norgay and Edmund Hillary, was in 1953, but attempts going back to the 1920s had already resulted in the deaths of several climbers. These days, climbing Mount Everest has become more common, with record numbers of ascents every year and reported crowds at the summit. But the harsh conditions remain —although some think of it as a tourist attraction for the rich, Everest is as dangerous today as ever.
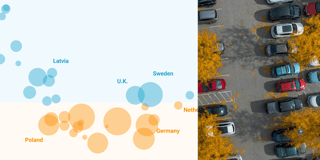
The chart below shows all the people who are known to have died on the mountain. You can hover over the tooltips to read about some of the climbers we know more about:
![[aria-description]](https://datawrapper.dwcdn.net/C7fbe/full.png)
Altitudes above 8,000 meters are known among mountaineers as the “death zone.” Because the air pressure is so low, staying at this altitude for an extended period of time results in deterioration of bodily functions and ultimately death. But the death zone is dangerous even before then, since bodily weakness and mental confusion from lack of oxygen can cause climbers to lose their footing, get lost, or make dangerous decisions. Most climbers use supplemental oxygen at this point, but not all.
Any mistake at these altitudes can be deadly. Making your own way back from Everest is a challenge, and carrying a whole other person is in many cases impossible. There can generally be no evacuations, and even the bodies of those who died are often left on the mountain. The climbing team usually moves the body out of sight, out of respect for the deceased, but sometimes the harsh environment and poor condition of the other climbers forces them to keep moving and leave their companion where they are. While there have been efforts to remove bodies by different authorities, over 200 are still on the mountain.
Some of the corpses are used as landmarks, with nicknames such as “Sleeping Beauty” and “German Woman.” The most famous one is Green Boots, which could be seen by all expeditions on the north side route until it was moved out of sight in 2014. The body is unidentified, but may belong to the climber Tsewang Paljor, a 28-year-old Indian policeman who died on the mountain in 1996. According to adventurer Noel Hannah, “about 80% of people also take a rest at the shelter where Green Boots is, and it’s hard to miss the person lying there.” This really put into perspective for me how present and normalized death is on Everest.
A note on using LLMs for spreadsheet help
The data set I used for this chart, from the Himalayan Database, came with a "Cause of death" column that always ended with the altitude the person died at in parentheses, as in Avalanche (6900m). Sometimes there would be an additional set of parentheses in the cause itself, as in Illness (non-Altitude sickness) (6150m).
Being a developer who’s more familiar with code than spreadsheets, I was about to write a Python script to extract the altitudes from this column. But then I stopped myself, went to ChatGPT and wrote:
I have a google sheet with a column where the data looks like this:
[Here I gave some example rows in a code block.]

I want another column that only contains what is inside the last parentheses for each value, without the "m".
Lo and behold, the reply suggested = REGEXEXTRACT(A1, "\\((\\d+)m\\)"), which I adapted to contain the first cell of my "Cause of death" data and pasted into Google Sheets for the entire column. All in about a minute! I was also able to reorganize a second column in a similar way. Overall, spitting out regular expressions and spreadsheet formulas from example data and a description of the desired result seems to be a job LLMs are well suited for.
There is much more to read about this topic — a good start is the Wikipedia articles linked in some of the chart tooltips, which often contain fascinating stories.Then come back next week for another Weekly Chart by one of our co-founders, Gregor.