New: Small multiple column charts in Datawrapper
February 18th, 2025
6 min
This article is brought to you by Datawrapper, a data visualization tool for creating charts, maps, and tables. Learn more.

To make it easier for you to automate how you create and publish Datawrapper visualizations, we’re happy to announce that we are releasing a new Datawrapper API today. Thanks to the API, you will be able to
…with a few lines of code.
For example, you could write a script that automatically updates the data of a chart & changes the description of the chart so that it states when the chart was updated. Find a tutorial for this use case here.
You might be wondering: “I thought Datawrapper already has an API?” Indeed! We’ve had an API for quite some time now in the beta version (and some of you have used it). But in the last few months, we rebuilt it from scratch; making it more usable and better documented than ever. Kudos to our developer Fabian for working the API itself & writing the documentation for it!
So far, the API was only available to users who paid for a Team license or up. Starting today, it is available to everyone – for free. All you need is a (free) Datawrapper account and an API Access Token you can get (for free) in your Datawrapper settings.
You can find tutorials on how to get started, how to create a chart, and how to integrate the API in our Developer Docs; among other guides. That’s where you will also find the API reference.
If you’re curious to see the underlying code, visit our API Github repo.
Maybe you have no idea of what we’re talking about. Let us give you a short introduction into the wonderful world of application programming interfaces (APIs):
An API is an interface to communicate with other programs or services. In our case, it lets you access your Datawrapper data without using the Datawrapper web app you’re used to. Data like: When was a visualization created? What data does it show? Which colors does it use? Which chart type? Annotations? Line width? Marker size? Every setting in the Datawrapper app is also a data point in our database, saved somewhere on a server in Frankfurt, Germany.
And now you have control over it! You can read this data, and you can write new data points in there – for example creating a new chart, or overwriting the settings of an old one.
Let’s see how this works. Imagine our database as a giant blob. The API is the surface of that blob; connecting you with the data. And you can enter the database – but only if you know the address to a door and if you have the key to this door. The key is the API Access Token you can generate in your user settings. The addresses are URLs, like https://api.datawrapper.de/v3/charts (“v3” stands for “version 3 of the API”). Try to open that in your browser. If you’re logged in, you will see a long list of your charts. Congrats! You’ve just successfully peaked into our database.
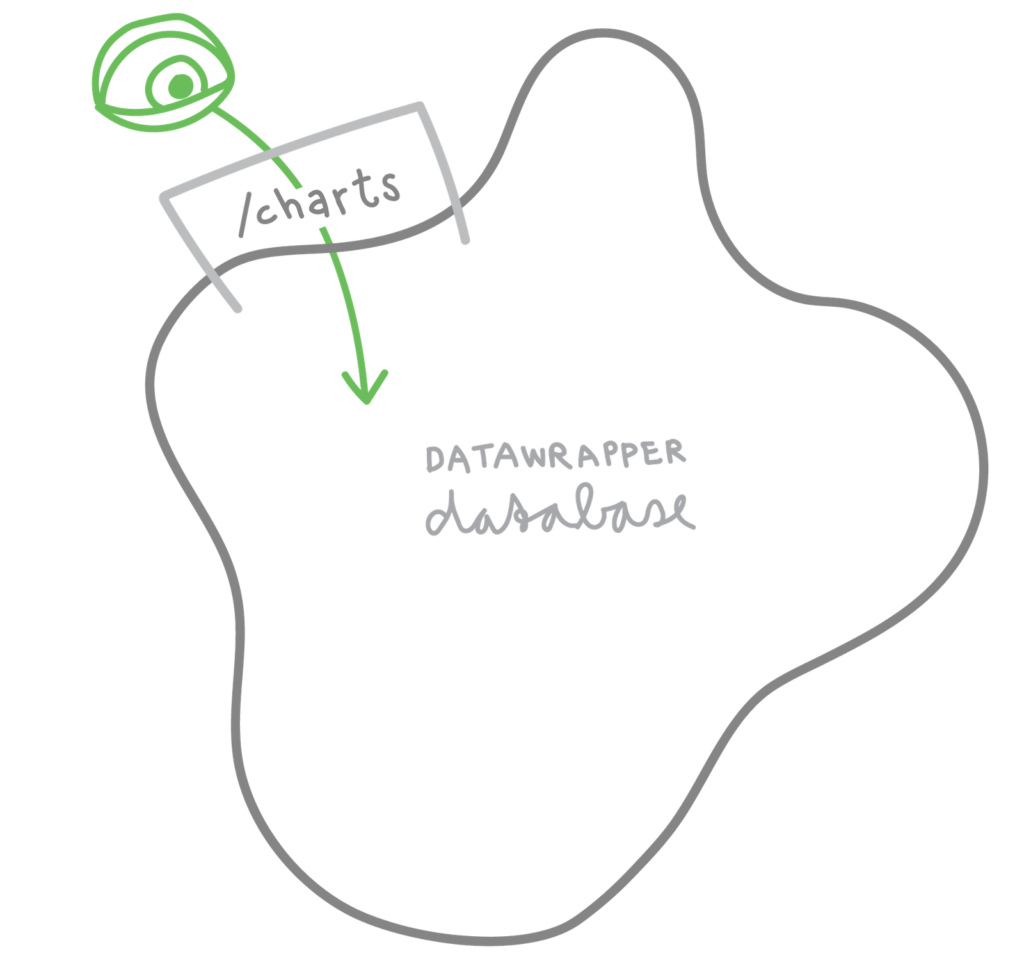
But maybe you don’t just want to see a list. How can you actually do something, like creating a chart? That’s what the so-called “HTTP methods” are for. These are basically verbs that let you do stuff. With GET, you simply read the database. The other verbs are more active:
You can learn more about HTTP methods in this guide in our developer docs.
To create a new chart, we put the POST verb before our URL and define the chart type and title of our chart with a JSON:
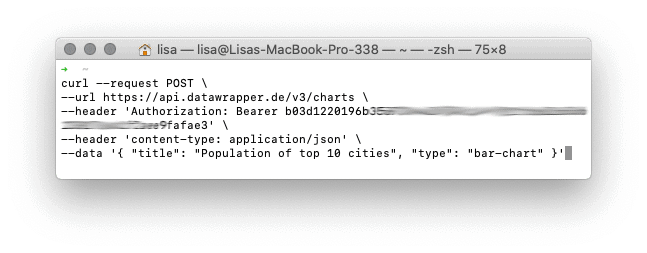
Here’s what this code does: It opens the door /charts with the POST verb. And because the /charts door is responsible for charts, it creates a new chart in our database:
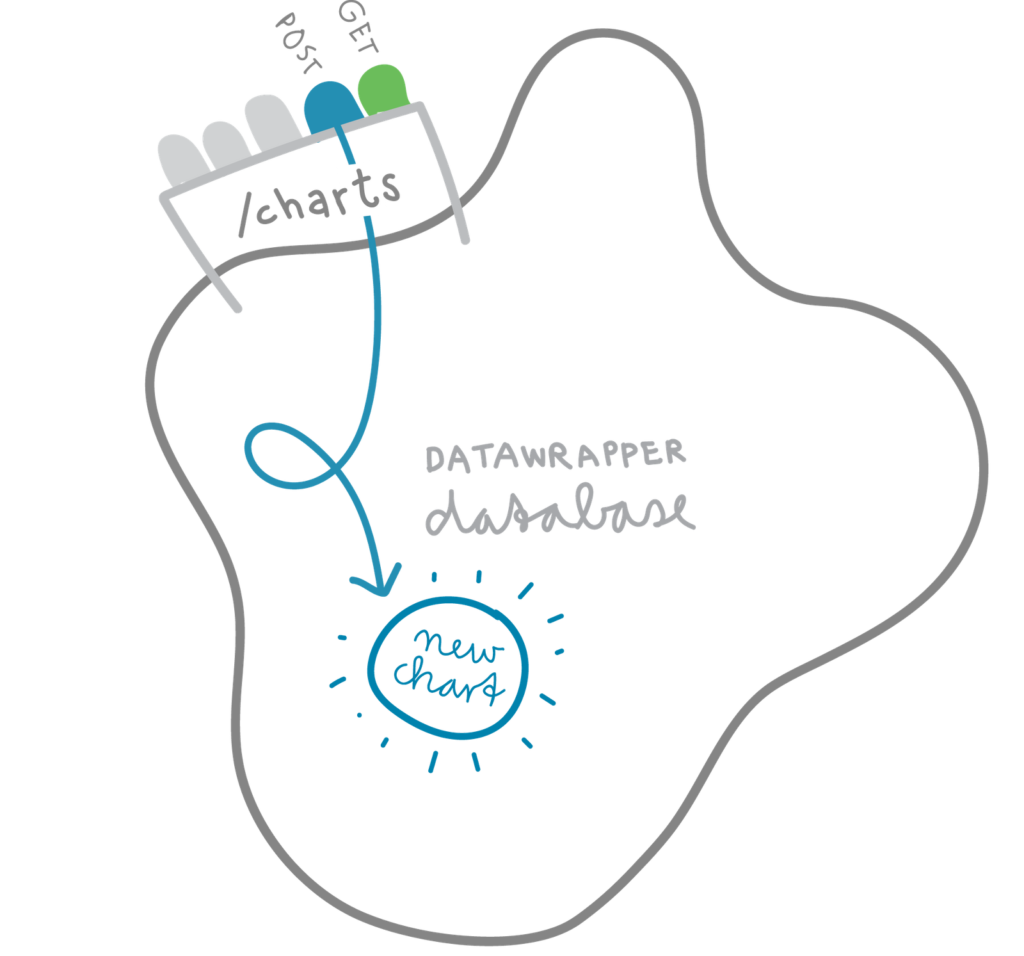
/charts are /charts/{id}/data, /teams, /me (for your personal settings) and many more. You can find them all in the API Reference.Not every door can be accessed with every HTTP method, though. For example, /charts only let you use GET (a list of charts) and POST (a new chart). That makes sense: Once you created a chart, it has an ID with which you can access it. So if you want to edit or delete your new chart, you will need to use the door /charts/{id}. There, you can DELETE your chart.
Here are some (not all!) doors of our Datawrapper API and the verbs with which you can access them:
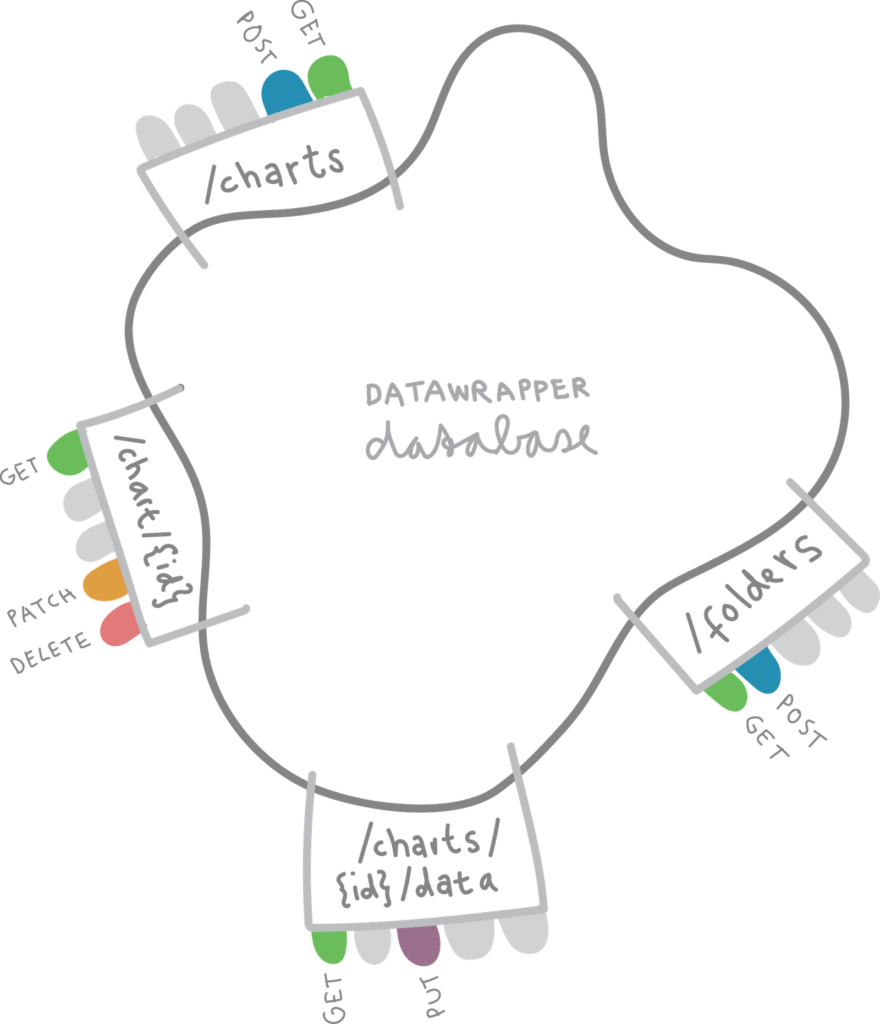
You can find the HTTP methods for each door (=endpoints) in our API Reference, too.
But why go through all this hassle? Of course, in most cases you don’t need to: The Datawrapper web app already lets you create, edit and publish visualizations with a user interface. What the API provides is an application interface. Other applications can now speak to Datawrapper, not just users. You could create charts directly from within your CMS. Or you could ask Siri or Alexa to update charts.
And here’s where it becomes mind-blowing: Our very own user interface is an application that also uses the Datawrapper API. If you change the colors of a bar chart in Datawrapper to red, Datawrapper tells the Datawrapper API that you want to do so. The API checks if you’re allowed to do so and changes a tiny entry in the database blob – an entry that then again tells your chart that it should be displayed in red.
That concludes our little introduction to our API! If you want to learn more, head over to our “Get started” guide. There you will learn how to generate your own API Access Token and make your first proper API requests.
We hope you like the API! We will continue to improve this API and add more endpoints. If something is unclear in the documentation or if you have feedback for the API itself, let us know at support@datawrapper.de. As always, we’re looking forward to hearing from you.
Comments