


New: Keep your account secure with two-factor-authentication
March 27th, 2024
3 min
This article is brought to you by Datawrapper, a data visualization tool for creating charts, maps, and tables. Learn more.
Datawrapper’s goal is to let you communicate data beautifully – responsive, well-designed, interactive where it makes sense, in your brand design, without the need to code and printable thanks to our PDF export.
So what’s the most straightforward way to communicate data?
Arguably, it’s a table. We know that they’re close to your heart: Tables have had a place in Datawrapper since we launched seven years ago, and have been consistently among the top 5 visualizations our users use (while not even being a visualization, strictly speaking!).
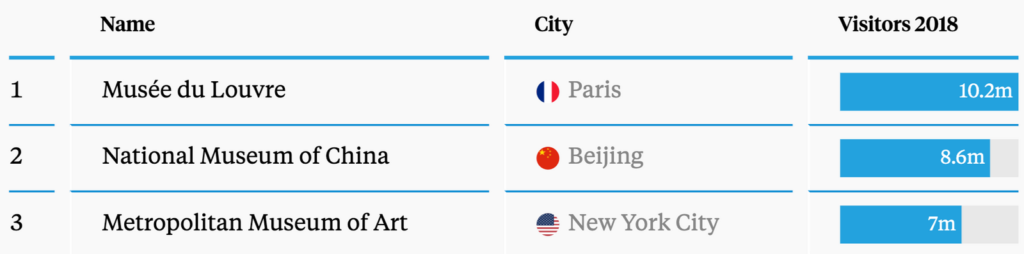
So it’s about time that our tables get a proper update. Starting today, you can create tables like this one with Datawrapper:
We built a table tool for all use cases you might have. You’ll find the following features in our new tables:
That’s not all: You can choose between a compact & normal layout, parse markdown to format text and add links, stripe your table, show ranks, show tiny flag icons with one click and style or hide the table header.
Let’s talk about the most exciting new features in detail:
When creating a table, select several number columns with Shift and turn them into tiny line charts called “sparklines”. They’re great for bringing some nuance into your table: Instead of just showing the first date and last date (e.g. 1960 and 2016), you can now show how the variable developed over time.
We also still have the option to create bar charts. Select a number column, click “Show as bar chart” and voilà: Your data becomes more easily comparable.
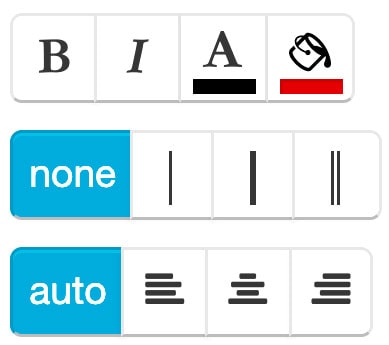
You can now style each row and column individually. Highlight the most important rows or tone down columns that add only background information. Change the font style, color, background color, column width, add border lines, customize number and date formatting – or select multiple columns and style them all at once.
With our new tables, you can style individual cells based on categories defined in your dataset. Maybe you want to color negative numbers in red. Or color the background of states with the color of the party that won the election. Or create heatmap-like cell backgrounds with our new heatmap feature.
Yes, that’s a Datawrapper table, too. You can add images with markdown – write  in your data and then enable Parse markdown in step 3: Visualize. Play around with the scale of your column or row until you’re happy with the size of the images. And make sure to check how they look on mobile devices!
As with many visualization types, the most interesting question is often “Compared to what?”. In a table, you might want to compare each state with the national average. Or you want to compare each football team to the one the story is focussing on. You can highlight rows using custom styling, but there’s a problem with longer tables: the highlighted row might not be on the current page.
That’s where sticky rows come in handy: a sticky row will show up in the table no matter what your readers do. Even when they use the search input to filter the table, the sticky rows will be there:
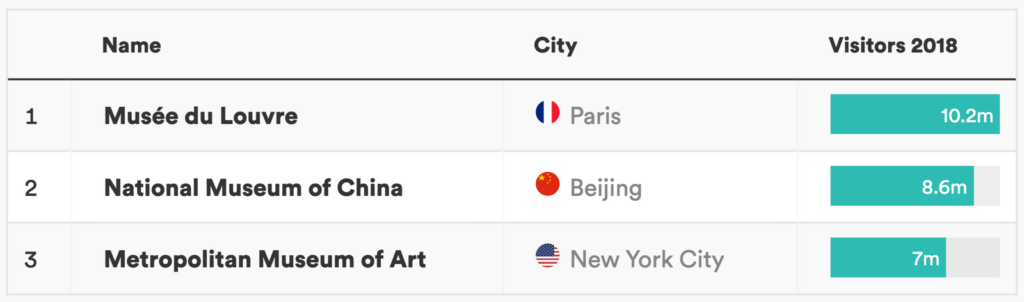
You might create tables to let readers look up the information that is of most interest to them – about the city they live in, the party they voted for, or the income they have. Our tables offer custom column sorting and a search functionality to help your readers achieve that goal. Together with pagination, they make for a great exploration tool. For example in the following table, try searching for “London”, “Paris” or “Tokyo”:
Making tables work on mobile is no easy task. We offer two solutions: You can decide if your table should be horizontally scrollable on mobile (that’s the default) or displayed as cards (select “Mobile fallback” to make that happen).
But often, the main factor in making tables work on both desktop and mobile is the number of columns. On a big screen, more columns will fit (and look beautiful!) than on a small screen. That’s why you can now hide less important columns on mobile, while still showing the full table on larger devices:
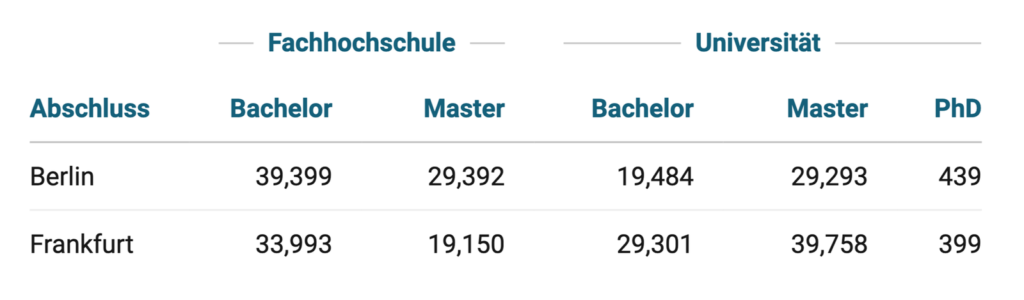
Sometimes, one header line is not enough. Sometimes, you need two: To structure the many columns you have into two or three categories; or because you don’t want to repeat yourself in the column headers. Datawrapper lets you add two header rows: Enable Merge with empty cells and Add first row to header to make that happen and wrap your header text in little ~~~s to create a line left and right of the text.

How you set up your data in step 1: Upload data
How your table looks like in step 3: Visualize and for your readers
As part of our Custom plan, we offer to build a design theme for you, so you can create charts and maps in your company style. If you’re part of an organization with such a design theme, we have already migrated your styles. You can start using the new tables in your design right away. Do get in touch with us if you wish any changes: support@datawrapper.de.
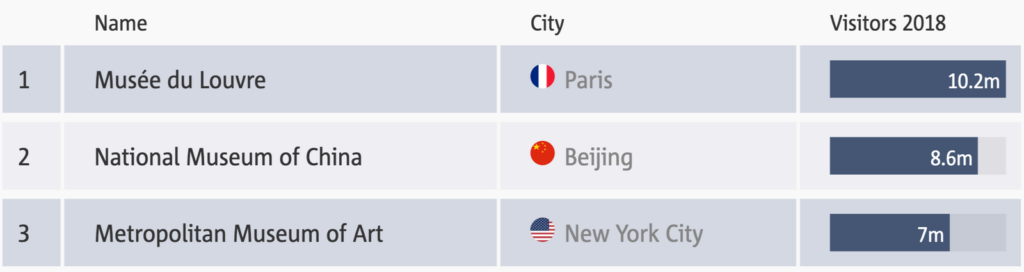
Examples for our new tables in design themes by our users
We are a bit perfectionist. Like all our chart & map types, we want to enable you to create great-looking tables with Datawrapper, even if you’re not a designer or data vis pro.
Let us know if you have ideas about how we can help you. We’re always eager to make our tool even easier to use.
If you’ve been using Datawrapper tables before, you might wonder what happened to our old tables. We used to have two: The “long table” provided pagination and search input for filtering rows. The “short table” let you use a lighter style, allowed custom styling of rows and displaying columns as bar charts. The new table has all options from the old tables, so you won’t miss anything you’re used to. But for now you can still use the old tables: You’ll find them in the “Archived chart types” below the Chart type selector.
We hope you’re as excited as we are about the new tables. As always, do let us know if you have feedback, suggestions or questions. We’re looking forward to hearing from you at support@datawrapper.de.


Comments