

New: Small multiple column charts in Datawrapper
February 18th, 2025
6 min
This article is brought to you by Datawrapper, a data visualization tool for creating charts, maps, and tables. Learn more.
We updated our step 1, “Upload Data”
Update: The beta test is over, the feature is launched.
We’re launched our new data upload page, which introduces three exciting new ways to get your data into Datawrapper.
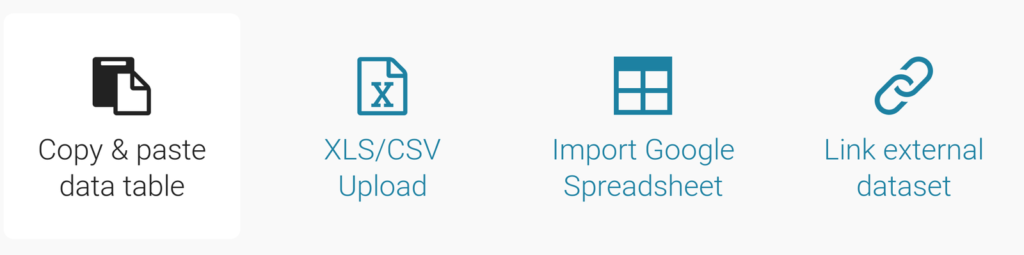
In addition to the current options (copy & paste and CSV upload), you can now
Until now you could only upload CSV text files, but thanks to the amazing Sheet.js library, Datawrapper can now import your Excel / OpenOffice / LibreOffice spreadsheets as well (basically every file with the extensions XLSX, XLS, ODS, CSV, TSV, TXT or DBF). If the document contains multiple sheets, you will be asked to select the one you want to import.
Note that we’re still only storing the one sheet you chose to import. So if you want to access the other sheets later, you’ll need to upload the file again.
In case you’re already working with Google Sheets you may be pleased to hear that you now can connect them with Datawrapper directly. To do so, you need to make sure that Link Sharing is activated for the document and then paste the Google Sheet URL into Datawrapper.[1]
Datawrapper updates your data from your Google Sheet every time you open the chart or reload the site. You don’t need to worry that all your published charts suddenly update every time you make changes to your Google Sheet: You need to publish your chart again before the new data becomes visible.
Sometimes, you do want a chart to update as soon as the data updates, for example in an election. We now offer a way to do so. Even in published charts the data will be kept up to date. That means that for every chart view, the data will be downloaded freshly from the original URL.
This can be a bit tricky, technology-wise[2]. To make it easier, we take care of the complicated stuff for you. We decided to throw in a free data hosting service. Meaning, you just upload the CSV to e.g. your website, Github, or even Google Sheets (we explain you how in this Academy article). From there we copy it to our own server in certain intervals (every minute on the first day, then every hour the next 29 days), and your Datawrapper chart will pull the data from there:
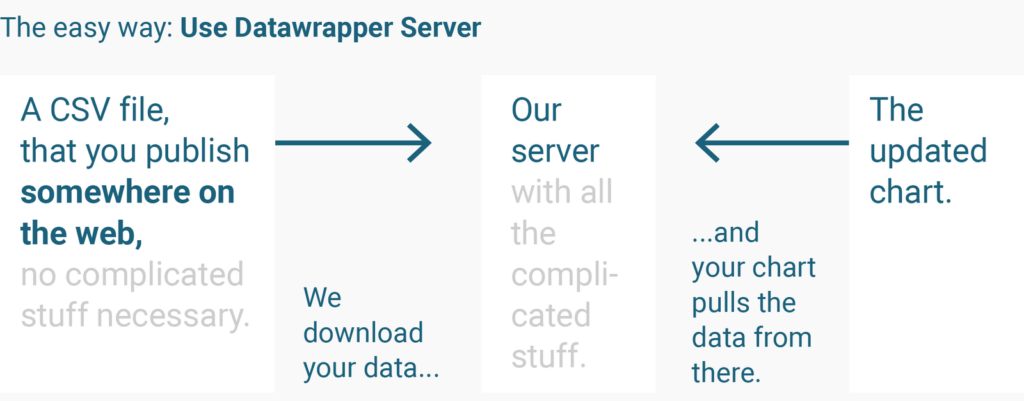
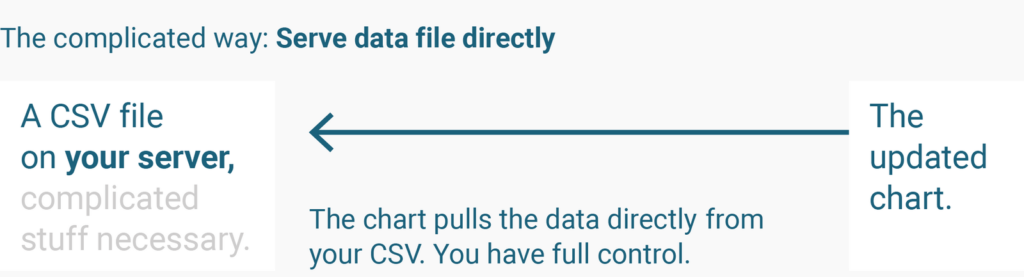
If you don’t sweat about all these technical terms (HTTPS, CORS, and high traffic) and want to have full control; or if you need a higher update frequency, we still offer you the complicated way:
We hope that you find these changes helpful. Please do let us know if you have some feedback, via email or in the comments below!


Comments