

New: Automatically label data points in line charts
September 18th, 2024
3 min
This article is brought to you by Datawrapper, a data visualization tool for creating charts, maps, and tables. Learn more.
We’re excited to introduce our new place labels: Starting today, you can add as many city, region, and country labels to your choropleth and symbol maps as necessary.
This new option will greatly help your readers to orient themselves on a map, especially for administrative regions they’re not used to.
To add the new labels, go to step 3: Visualize in any choropleth or symbol map. In the Annotate tab, you’ll find the option Map labels right below the description fields. Turn on Show labels — and there they are!
You can add up to 30 places, capitals, regions, and countries with a slider and search for additional ones by name. All labels will be displayed in the language you choose in the output locale in the Layout tab. (Pro tip: You can also paste a Google Maps link of a place in the search bar!)
For each of the added places, you can change the label text, style (point, capital, region, country), and position for point and capital labels (top right, bottom right, top left, or bottom left). You can also invert the label color from white to black to draw more attention to them or make them more readable on bright areas.
Let’s answer other questions you might have about this new option in a Q&A format:
No matter the map size, only places that fit will show up. Labels that would overlap won’t show up. On small screens, labels first try to change their positioning (e.g. from top right to bottom right) to not overlap with other ones. If that doesn’t work, they simply disappear.

As you can see, that’s different from your annotations — they always show up, either directly on the map (if it’s big enough), or as a key on smaller screens.
When you zoom in, the labels stay the same size. You might see some more labels pop up now that they have space, but never more than the ones in your labels list.
We also changed the behavior of our labels slightly: When zooming in, they are no longer hidden if they “touch” the edges of the view.
Yes, you can. It will work without any extra work from your side. Upload your GeoJSON or TopoJSON to the choropleth/symbol map editor, go to the Annotate tab, and use the Map labels option as described above. This will work for every map with the correct coordinates.
Yes! For now, they look the same as your column labels. But get in touch with us at support@datawrapper.de and we will happily change the font, font size, and color/opacity of your place labels — the four place styles point, capital, region, country can even be styled differently — and the symbols of point and capital labels.
Up until now, you could choose any column and display the text/number in that column on your regions. And that’s still possible! Select by column to see and use this option:
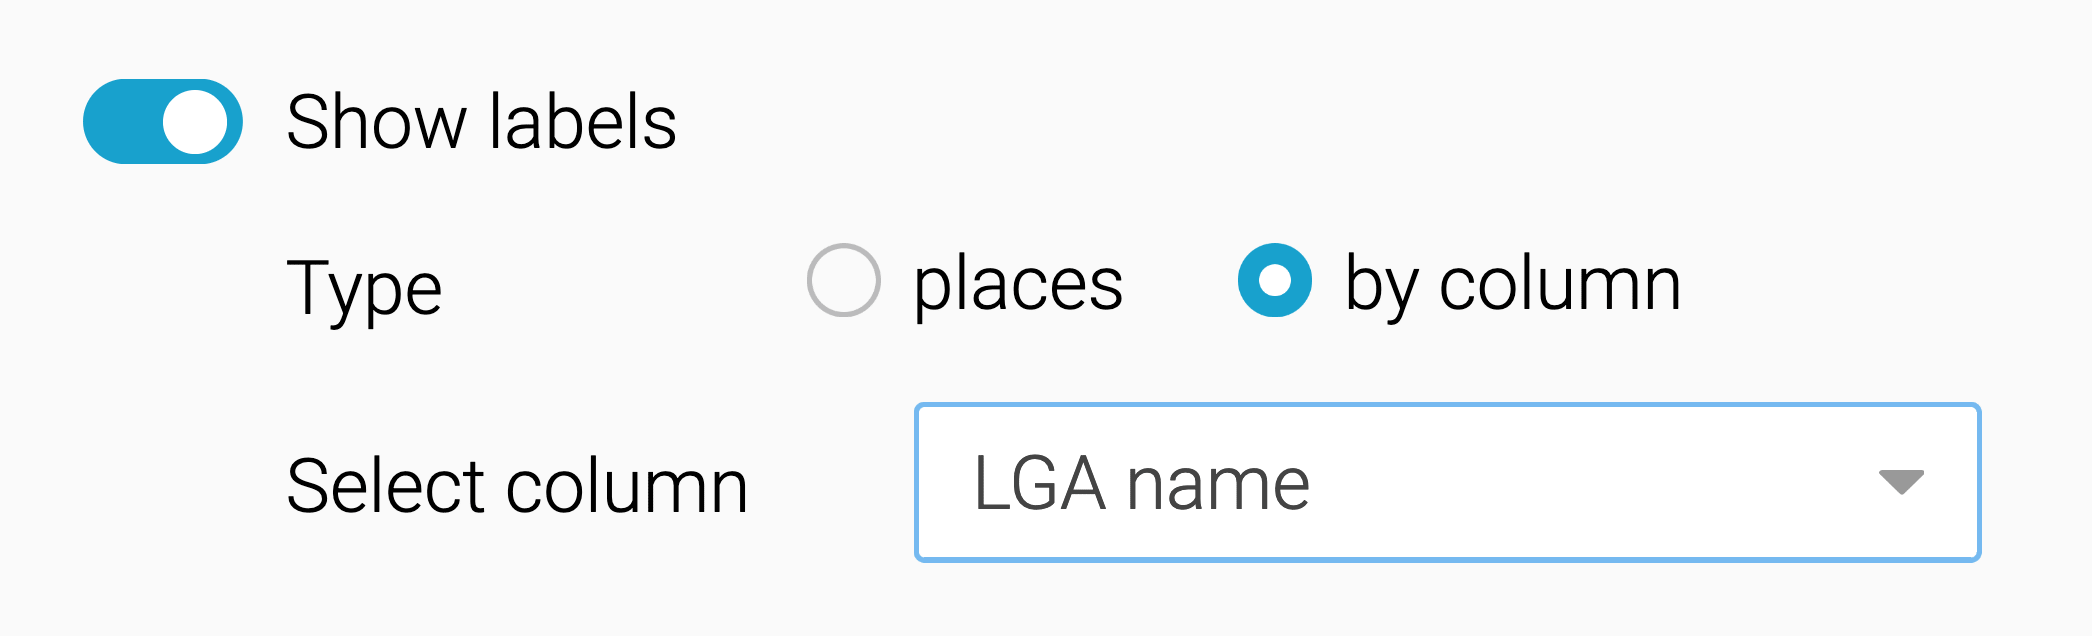
You might notice that we changed the styling of these by column labels a bit: They now look like the regions labels you can choose when selecting places labels — meaning they’re slightly bigger than before.
We believe this new feature will help you create even better maps — and we’re excited to see them. To learn more about this new feature (e.g. how to control which labels show up), head over to our Academy. And as always, get in touch with us at support@datawrapper.de for questions, comments, and feedback. We’re looking forward to hearing from you.


Comments