Election madness 2024 — one year in the Data Vis Dispatch
January 9th, 2025
3 min
Datawrapper lets you show your data as beautiful charts, maps or tables with a few clicks. Find out more about all the available visualization types.
Our mission is to help everyone communicate with data - from newsrooms to global enterprises, non-profits or public service.
We want to enable everyone to create beautiful charts, maps, and tables. New to data visualization? Or do you have specific questions about us? You'll find all the answers here.
Data vis best practices, news, and examples
250+ articles that explain how to use Datawrapper
Answers to common questions
An exchange place for Datawrapper visualizations
Attend and watch how to use Datawrapper best
Learn about available positions on our team
Our latest small and big improvements
Build your integration with Datawrapper's API
Get in touch with us – we're happy to help
This article is brought to you by Datawrapper, a data visualization tool for creating charts, maps, and tables. Learn more.
Hi, it’s Marten, one of the developers here at Datawrapper. For this week’s Weekly Chart, we’re taking it way down south — all the way to Namibia!
Anyone who has experienced winter in Germany, and especially Berlin, is all too familiar with the winter blues. So a few weeks back I thought that now would be as good a time as ever to try out this remote work thing that everyone’s been talking about and escape the cold and rain for a while.
And so, because I have an awesome employer and because I happen to have some family there, I booked the next flight and headed off to Namibia! Surely with about 300 days of sunshine annually, Namibia is a safe bet to get some much-needed vitamin D.
Well, joke’s on me. It turns out that it’s actually been raining a lot here in Namibia. However, unlike in cold-as Germany, where people just hate the rainy, gray weather, the rainfall here in Namibia is considered to be a total blessing! So this time around for my Weekly Chart, I decided to take a closer look at the rainfall in Namibia.
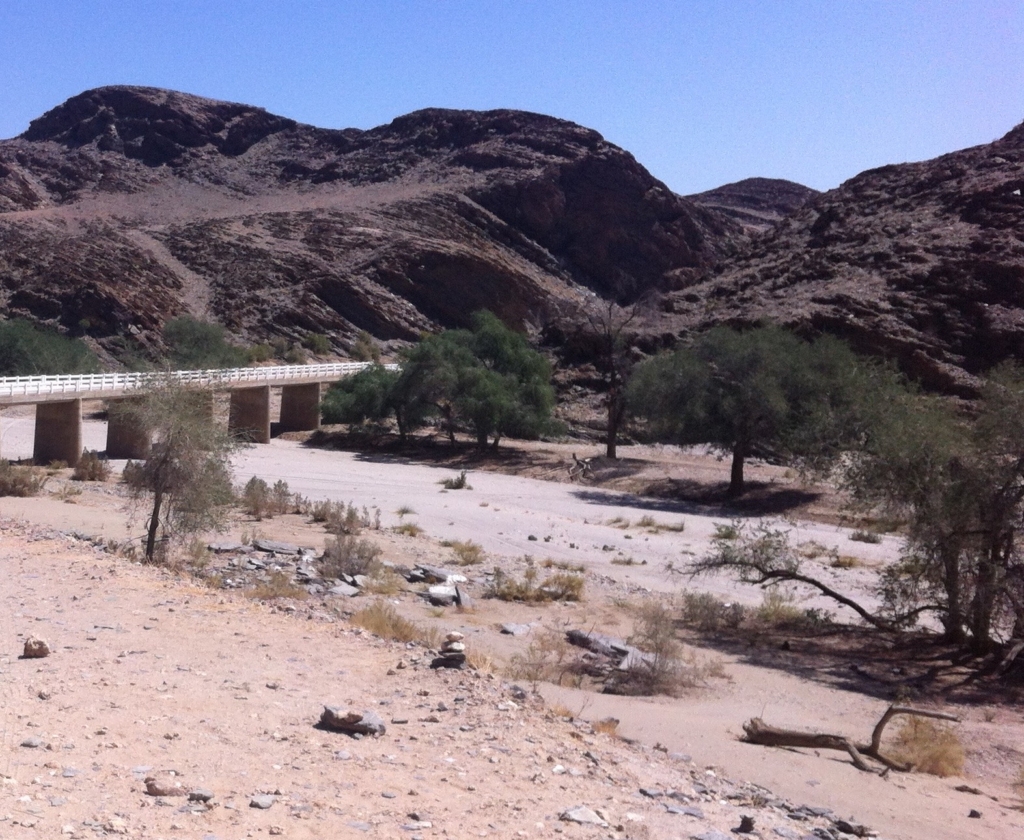
Namibia is one of the driest countries on earth and much of the country is covered by desert, with the Namib, the world’s oldest desert, to the west and the Kalahari desert to the east. In fact, rainfall is so rare that most rivers in Namibia are dry most of the time. Only with enough rainfall do these so-called ephemeral rivers fill up with water. Yet, with about 50% of the country’s population dependent on subsistence farming, even the rare rainfall is essential.

To get a better picture of Namibia’s rain, I got in touch with Sieglinde Somses from the Namibia Meteorological Service, who was able to provide me with daily precipitation records from the different weather stations across the country.
With that data, I was able to draw up the following line chart showing the average monthly rainfall in the years 2010 to 2021. The data was calculated by summing up the daily rainfall data for each station for each month, then averaging the monthly totals across all weather stations in each region, and then averaging the monthly rainfall across all regions.
The chart reveals that, while most of the rainfall happens in the rainy season from October to March/April, the amount of rain is anything but predictable. Clearly, the year with the strongest rainfall was 2011 with a total 694 millimeters of rain. On the other hand, 2019 was a very dry year with only 221 mm of rainfall.
💡 Rainfall or precipitation is usually calculated in millimeters (mm). This measurement roughly translates to liters per square meter.
From the data, I calculated a mean annual rainfall of about 421 mm over 11 years. Different sources online usually report a mean annual rainfall of around 270 mm.
I’m not exactly sure what causes this discrepancy — maybe “official” calculations take more data points into account. For instance, the data set I have contains almost no measurements from the coast, where it almost never rains. Or maybe I should have taken the land area of the regions into account.
Anyway, a mean annual rainfall of 421 mm in the last 11 years wouldn’t seem so bad compared to a country like Germany, which gets about 787 mm of rainfall a year. However, the chart doesn’t tell us the whole story.
The following map reveals that the spatial distribution of rainfall in Namibia varies greatly, from over 650 mm per year in the northeast to only around 150 mm per year in the southwestern and coastal regions. Right at the coast it usually rains even less, with annual rainfall around 5 mm.
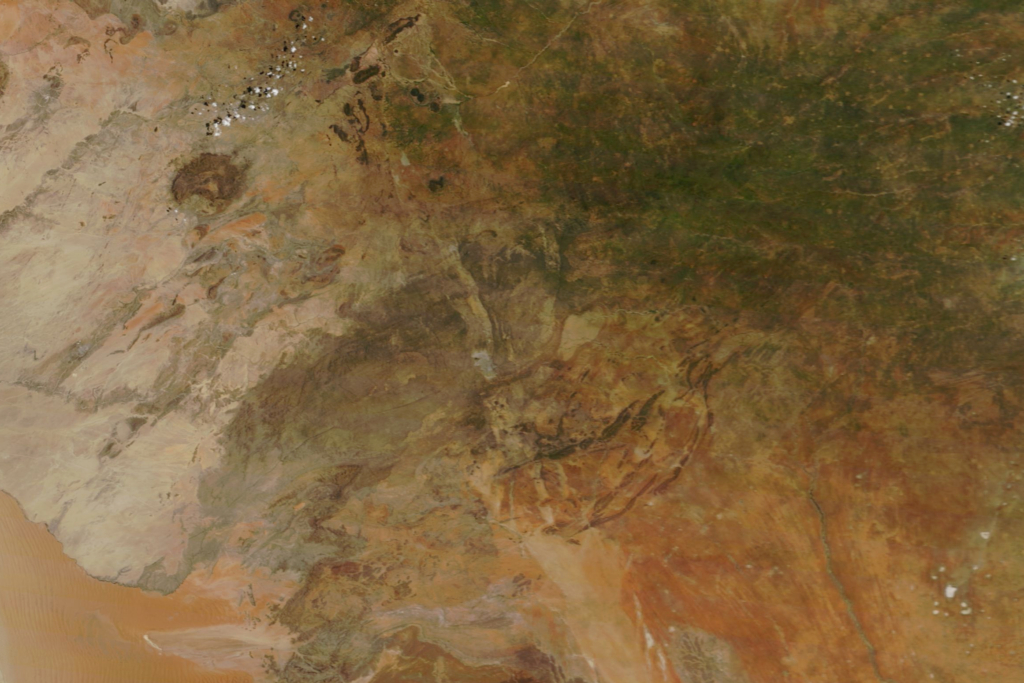
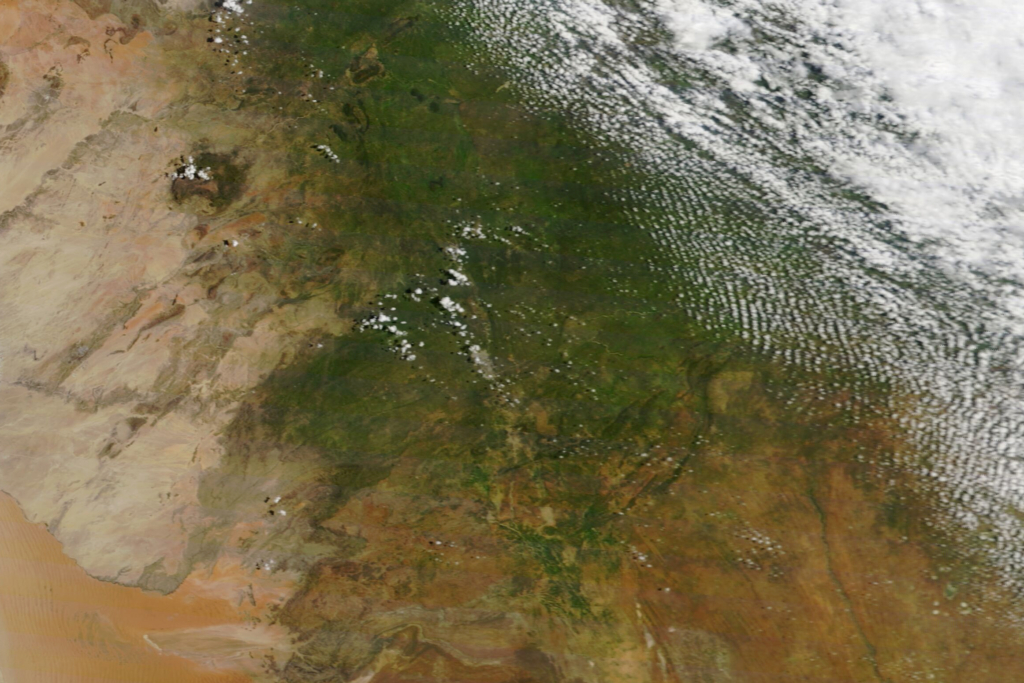
In all parts of the country, wildlife and people alike are highly dependent on the seasonal rainfall. If we look from above, the difference the rain has on the landscape becomes clear. The two images are taken from the NASA Earth Observatory project and show the same region in Namibia around the same time of year. The picture on the left was taken on January 29, 2020. The picture on the right was taken on February 7, 2021.


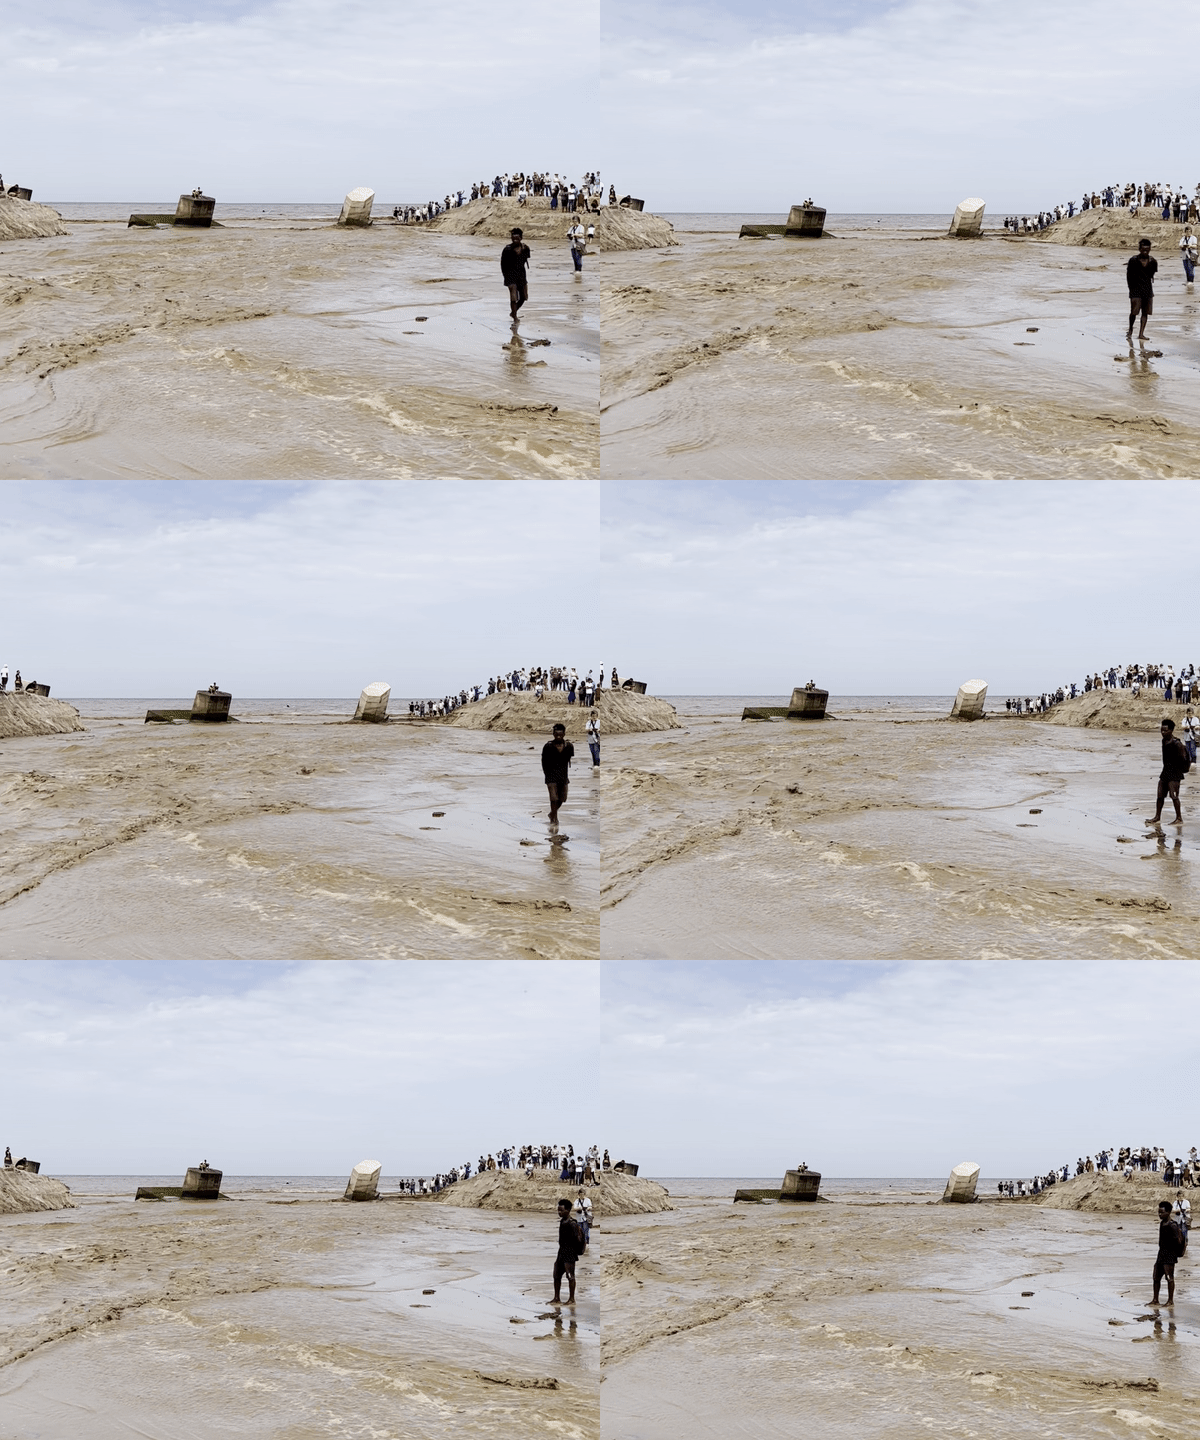
And so this year too, the people of Namibia are hopeful that this rainy season is going to bring enough rain for their country to flourish. It’s looking promising so far. The months of January and February have brought so much rain already that the river Swakop — which is usually completely dry all year round — has started filling up with water. Not only that, it has even carved its way all the way to the Atlantic Ocean. The last time that happened was in 2011!

And that’s it! I hope you enjoyed taking this little trip to southern Africa with me. Next week’s edition will be brought to you by our developer Ivan Lokhov.
Comments