

What to consider when choosing colors for race, ethnicity, and world regions
October 9th, 2024
11 min
This article is brought to you by Datawrapper, a data visualization tool for creating charts, maps, and tables. Learn more.
Sometimes, I give workshops. They are mostly introductions to data visualization. And if you’ve ever visited one of these workshops, you’ve seen this chart before:
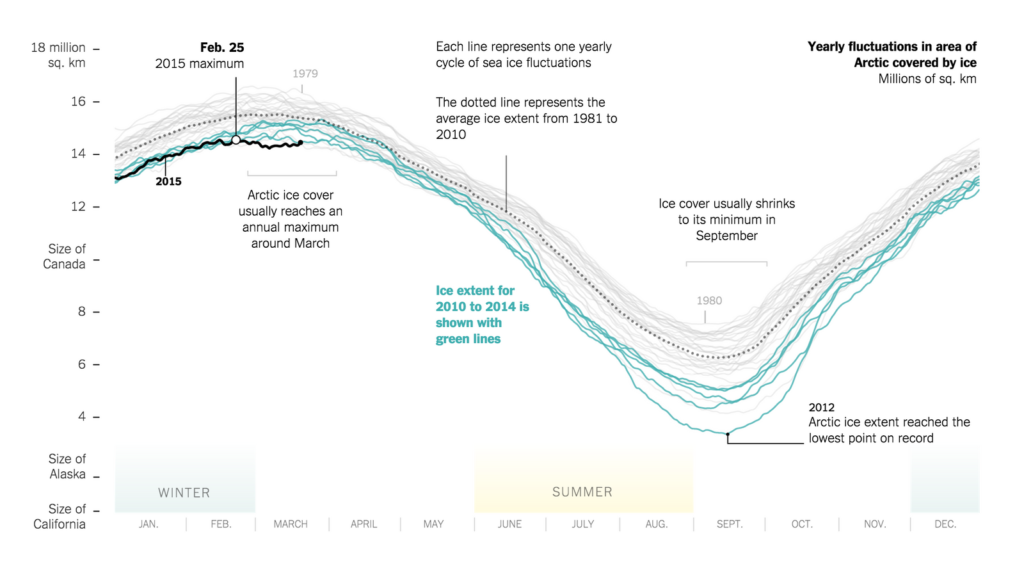
It’s a chart by the New York Times graphics editor Derek Watkins from 2.5 years ago, showing the “Yearly fluctuations in area of Arctic covered by ice.” Go ahead and visit this chart in its natural habitat on nytimes.com.
I love this chart. I love it so much. It’s one of my favorite charts out there. I’m getting excited every time I have the chance to talk about it.
Why is that? I’m glad you asked. That’s why: I feel like this chart respects my time as a reader.
There three reasons for that:
Here I’ll try to explain these three ways to save your readers’ time in detail:
Why do you want your audience to look at your charts? Maybe because you find them interesting yourself. Maybe because they prove a point you make with your article. Maybe because you want to explain something that’s better explained visually than with text.
In any case, you want readers to understand one or several things with your chart. And yes, it’s a great idea to show the data in a way that readers can see the important bits themselves. But if you want to make sure that they don’t miss your points, don’t just show them: Tell them.
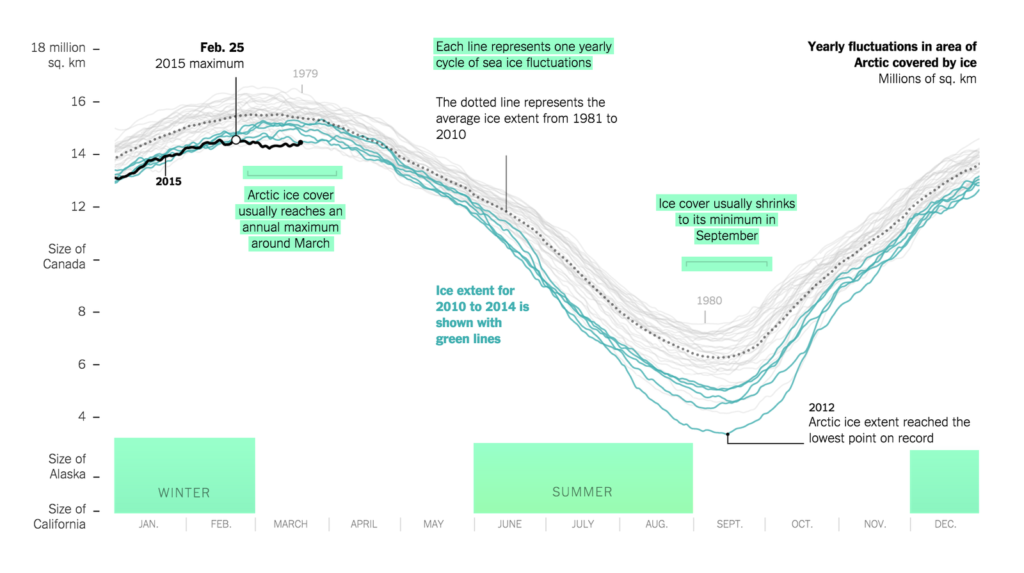
On this chart, Derek tells us. He wants readers to understand the cycle of artic ice: How the ice cover shrinks and how it grows over the year. So he writes: “Arctic ice cover usually reaches an annual maximum around March” and “Ice cover usually shrinks to its minimum in September” Could readers have figured that out themselves? Yes, because they see the timeline, and they see where the size of the ice peaks. But Derek writes it down anyway. To make sure that his readers get it.
Writing out the points you want to make is great for readers: They understand what you want them to understand, even if they don’t have the muse to spend 10min exploring your chart. And you make sure that they don’t misinterpret the data.[1]
But as a nice side effect, you will also need to think about the points you want to make with this chart yourself. What is it you actually want to show? (I wrote about the power of asking that question before.)
I’m sure you’ve seen graphics like that: Where the color key is in one corner and the lines or bars with these colors in the other. And your eyes go back and forth between them: “Wait, what did red represent?” (The interactive chart from the National Snow & Ice Data Center with the same data is a good example of that.)
Don’t be the person who creates these charts; I beg you. Bring elements and their explanations as close together as possible.[2] Reduce eye-traveling. Your readers will be thankful for that.
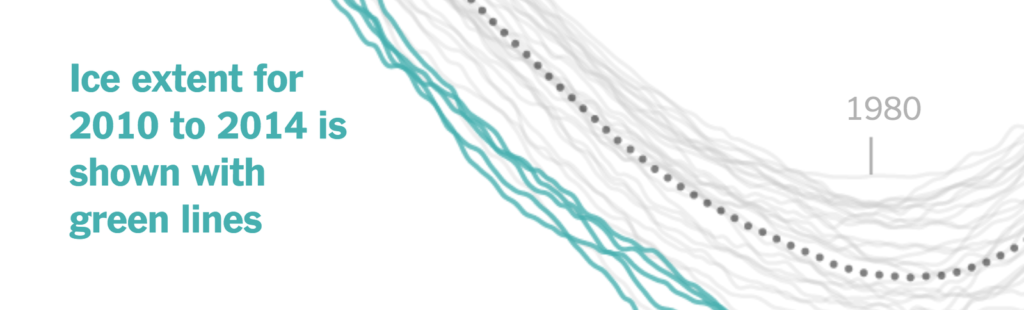
Derek does that everywhere in the chart. Here’s the explanation of the green lines and the grey line at the top, for example (he gets bonus points for using the same color for the label as for the element itself!):
If you want to read a whole novel just on this point, read Eugene Wei’s “Remove the legend to become one”.
Labels close to their elements.
Make your chart descriptions redundant. Ok, yes, it’s important to have a good description of your chart, and this chart has such a description in the top-right corner: “Yearly fluctuations in area of Arctic covered by ice”. But Derek didn’t stop there.
I’m not sure about you, dear reader, but I don’t read a chart description until I need to – meaning, until I notice that I absolutely can’t figure out what’s going on in the chart by myself. Descriptions are my plan B. They’re boring, and I avoid them. When I saw Derek’s chart for the first time, I didn’t say “Wait, Lisa! Before you can look at it, you need to read the description.” Instead, I dove right in.
That’s why it makes me so happy that on Derek’s chart, I don’t need to read the description. The phrase “ice cover” (and its synonyms) appear six times in the chart itself. The words “sq. km” and “size” on the y-axis give extra hints that this chart is about area (instead of, e.g., temperature). I don’t need to actively look for these kinds of information in the description; I get pushed towards them while I’m browsing the chart anyway.

In the best case, you’re using different phrases to describe the chart (like Derek did!). Readers will understand the graphic better if you do so. Sure, it feels like a chore when creating the chart: “Ugh, what’s another word for ice extent?”. But with every synonym, you’re reaching more (different) people. For example: As a non-native English speaker, maybe the phrase “ice cover” is part of my vocabulary, but “ice extent” isn’t. But for some of the native readers, it might be the other way round, and “ice extent” awakes more associations than “ice cover” does.
I explained three ways this chart saves me time: It tells me what I should pay attention to, makes sure my eyes don’t need to search for far-away color keys, and it makes descriptions redundant. Coming back to the feelings I explained at the beginning: When I look at this chart, I feel safe. I feel not even a little bit confused. That’s what I admire so much about this chart, among others. [3]
Making a chart that makes a reader like me feel so good about is hard. It needs time.
But the more time you invest in making your chart understandable, the less time your readers need to understand it. Let me repeat that: The extra time you spend making a better chart is the time you save your readers deciphering it.
P.S.: In 2017, the New York Times published an updated and interactive version of this chart:
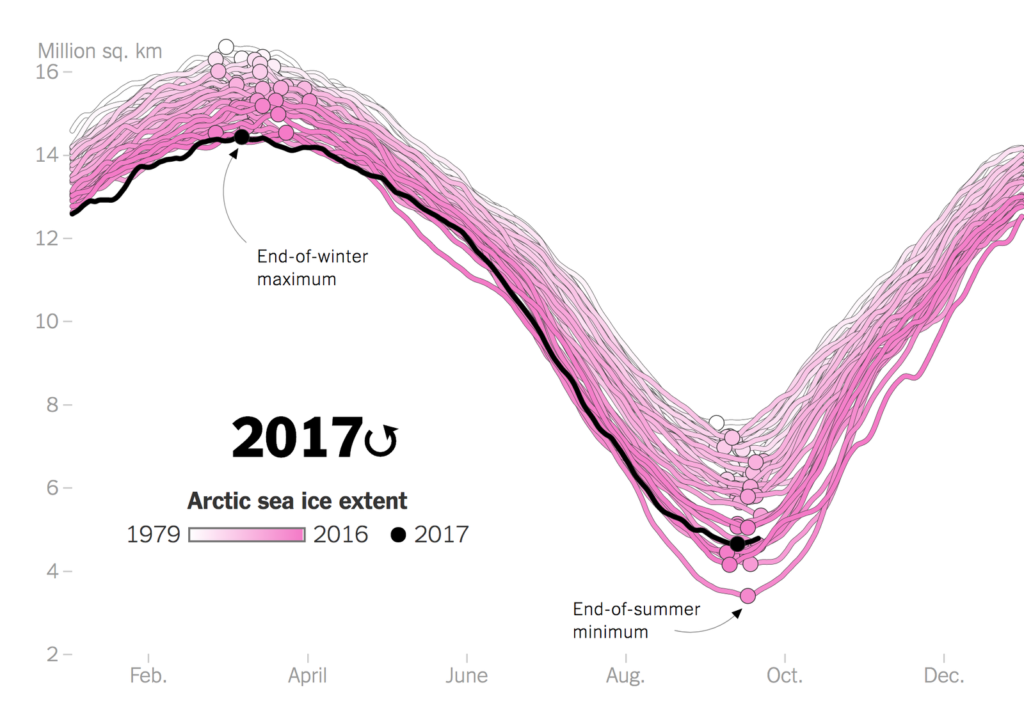
New NYT version from September 2017
It’s not built in Illustrator anymore (the tool that Derek used for his chart), but in d3.js. Annotations are gone, but now the chart is more responsive and there is a sweet animation. I asked Derek about it, and he said:
Nowadays we probably tend to put fewer annotations on our charts. I suspect some of that is due to the pressures of designing for mobile and desktop, and the shift towards designing mobile-first. For example, if you shrink the window down and look at the mobile version of that chart, most of the things you like about it disappear. One thing that’s interesting to me is how you can use animation to communicate some of the same information that you lose by having fewer annotations.
Animation is a relatively new technique for the dataviz community. To me, it feels like we just started to explore its possibilities. I’m looking forward to seeing if and how dataviz becomes more and more animated in the following years. But for now, I still prefer Derek’s version. Which one do you like? Let me know in the comments.
The disadvantage of spelling out everything you want the reader to get is the lost learning effect: We remember things better when we discover them ourselves, instead of reading about them or seeing them. I think there’s even at least one study about the effect of discovery on memorizing the content of a data vis 🤔 . If you know studies done in that realm, let me know, and I’ll add them here! ↩︎
If you’re working with Datawrapper, try turning off the automatically generated legend the next time you build a line chart. Then place annotations by hand directly on the lines. ↩︎
There are more things this chart does right: For example, Derek chose three different colors for the lines (and not more!) The boldest color (black) for the current year; the 2nd most striking color (blue) for the last ten years; the rest in grey. The priorities are exactly what they should be. Also, how big is 18 million square km? Nobody knows. Derek made the dimensions of the ice area relatable through comparing them to the size of known areas (Canada, California) directly on the y-axis. I’m a fan.
Such a great achievement doesn’t come out of nowhere. Derek told me: “I’m indebted to Jonathan Corum’s work. That chart was basically the result of me trying as hard as I could to make a Jonathan Corum graphic. (Which, now that I think of it, isn’t a bad rule of thumb in general.)” Check out Jonathan Corum’s work on his website 13pt.com. ↩︎


Comments