

New: Automatically label data points in line charts
September 18th, 2024
3 min
This article is brought to you by Datawrapper, a data visualization tool for creating charts, maps, and tables. Learn more.
Datawrapper charts, maps, and tables are fully responsive, meaning the width of your embedded visualization adapts smoothly to the width of your reader’s screen. Their height is often determined by the nature of your data — like the number of bars in a bar chart, or the shape of the country in your choropleth map. But some chart types give you more control over their height, including line charts, area charts, scatter plots, and all three kinds of column chart (regular, grouped, and stacked).
Today we’re introducing an improved way to set the height of these chart types, to make sure that your visualizations look great on all devices — be it a big screen, tablet, or mobile phone.
Instead of setting a height for your whole chart, you can now set a height for the plot — which is the chart area without header, footer, color key, or annotations. That means that long notes, titles, or lists of annotations displayed as mobile keys won’t take up the space of your actual data.
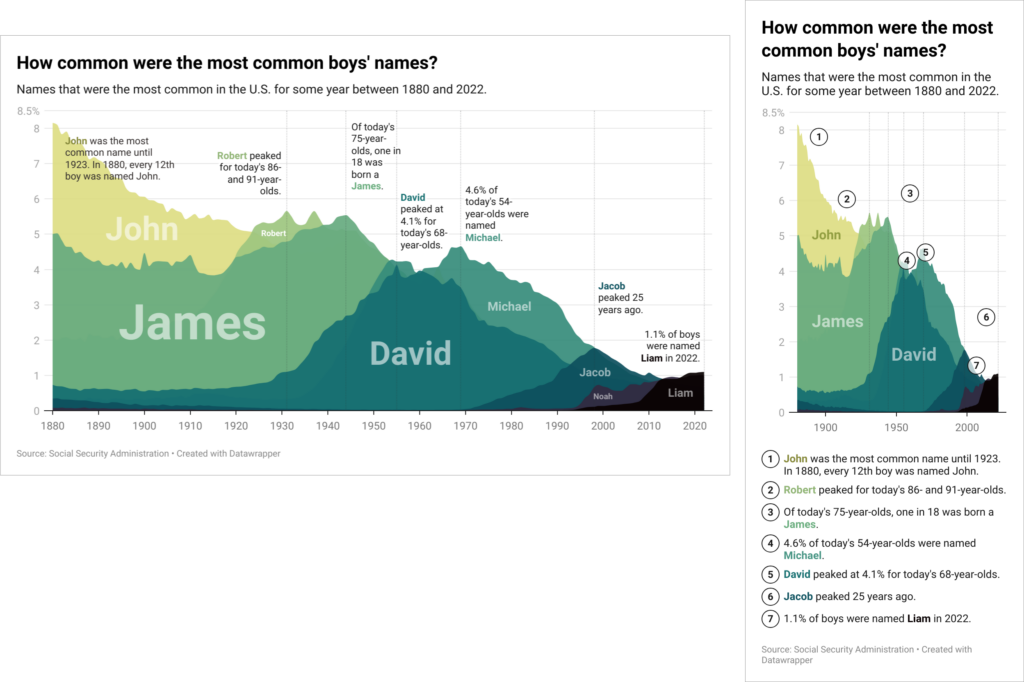
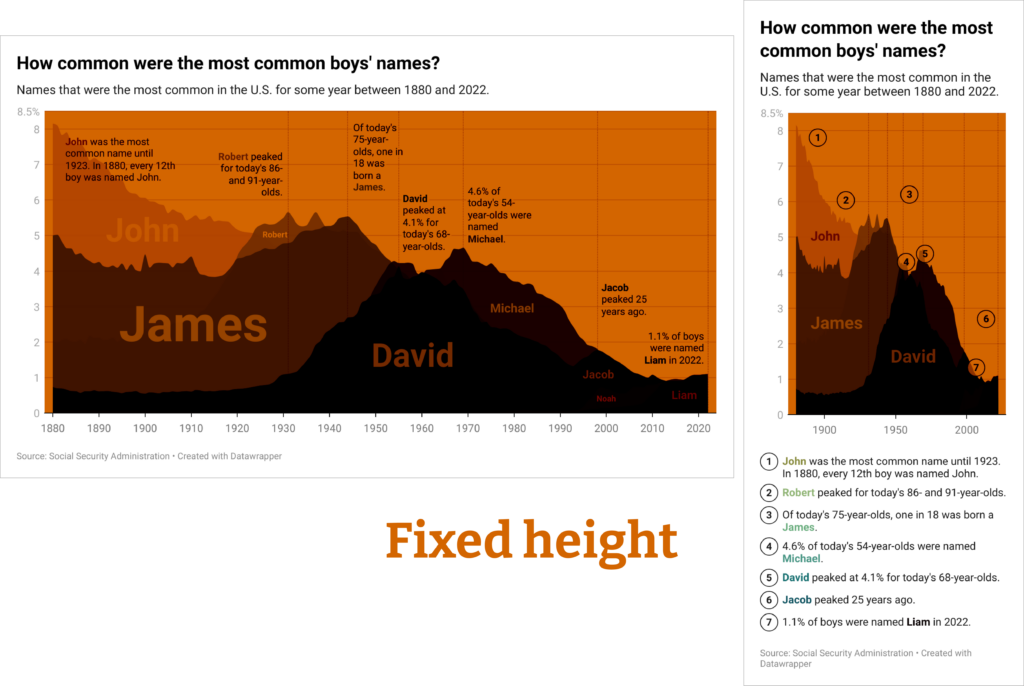
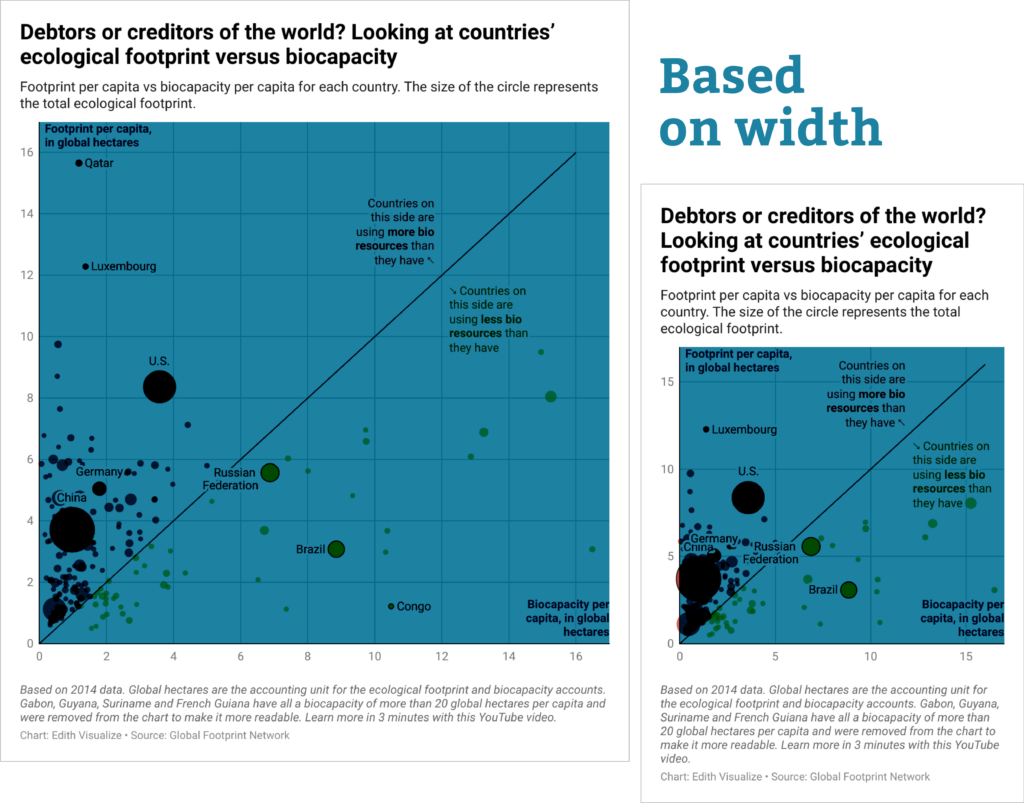
With our new controls, you choose the height mode that works best for your story. Sometimes you’ll want the height of your plot to be a constant at all screen widths (a “fixed height”). Other times, you might prefer a consistent aspect ratio that scales your plot proportionally based on its width. You decide.
We offer two easy ways to change the plot height of your chart. You can hover over the chart and drag the pink handle up and down:
Or, if you know exactly what size you need, simply type it in to the new plot height setting in the Refine tab of step 3: Visualize, and your chart will update accordingly.
These new plot height settings are only relevant when your chart is embedded responsively in a webpage, where the total visualization height varies with the width of your reader’s screen. That total height is determined by your plot height choices as well as by the space needed for all other elements inside the chart, including title, description, and color key.
For print layouts and other static formats, you’ll still be able to define the exact total height of your visualization when exported as a PNG, PDF, or SVG. With our new feature, you can now confidently preview and control exactly how your chart will look for all readers in print and online.
Thanks to everyone who worked on this feature! Please let us know if you have any feedback on the new plot height settings at support@datawrapper.de. We’re looking forward to hearing from you.


Comments