This article is brought to you by Datawrapper, a data visualization tool for creating charts, maps, and tables. Learn more.
Is the Rhine drying up?
Some water levels on the Rhine river have gone below 0. What does that mean?

This is Simon, a software engineer at Datawrapper. This week I’m looking at data about the current all-time low water on the Rhine river.
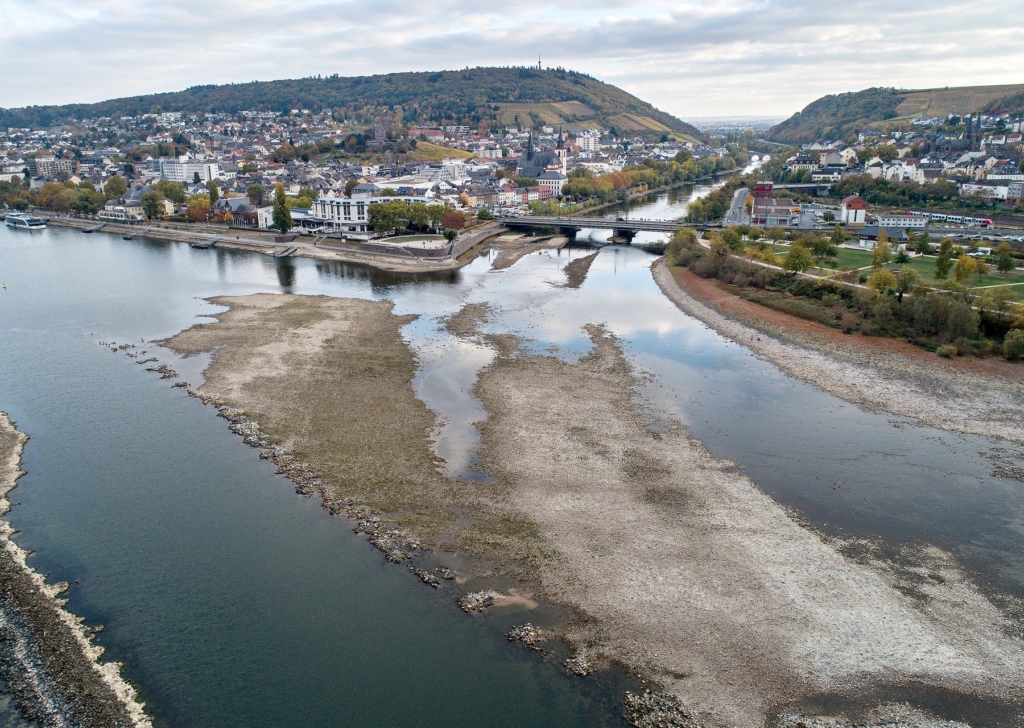
For centuries, the Rhine river and its network of tributaries have been a lifeline for Western Germany, as well as for parts of Switzerland, France, and the Netherlands. The Rhine is Central Europe’s second longest river, and normally carries vast volumes of water from the Alps, the Vosges, and other mountains through some of Europe’s most populous regions. But this summer, like other rivers in Europe, the Rhine is on the verge of drying up.
On August 17, the Kaub gauging station, located at the shallowest part of the middle Rhine, reported a water level of 34 cm, a gauge level that’s considered to be virtually impassable for cargo ships. In Emmerich, on the lower Rhine in northwestern Germany, there were even gauge levels reported as -3 cm, which is 10 cm lower than the previous all-time low of October 2018.
So has the Rhine dried up completely near Emmerich? The answer is no, or at least not yet. While the water levels are extremely low, a negative level does not necessarily mean there’s no water in the riverbed. The water level of a river, also called the stage, is measured using stream gauges based on a local reference height. So a stage of 0 or even a negative value is possible without the river going completely dry. The water level in Emmerich is, however, very low when compared to the reference point that was historically assumed to be lowest possible stage at that specific location.
Both low and high water have been normal, recurring events on the Rhine. Due to the climate crisis, however, such events are becoming more frequent and more severe. After low water in 2018 and high water due to the severe floods in 2021, we are once again in an extreme low-water phase.
How low water levels impact the economy
The current drought in Europe, possibly the worst in 500 years, is not only a serious problem for humans, wildlife, and agriculture. As rivers are warming and running low on water, the climate crisis is heavily affecting manufacturing industries and energy production. Earlier this summer, France had to cut nuclear power production along the Rhone and Garonne because reactors could no longer be cooled effectively by river water. On the Rhine, it is mainly freight transport that is impacted. The logistics of many German industries depend on the river, as does the supply of coal-fired power plants, which have regained importance in the current energy crisis.
Disrupted Rhine shipping is a perfect example for the real costs of climate change. Under low water conditions, ships can only transport a fraction of the cargo they would normally carry, driving the prices for cargo up. During extremely low water, when ships can no longer pass certain sections of the river, supply chains are even at risk of coming to a complete standstill. The last disruption of Rhine shipping due to the low water phase of 2018 is said to have decreased Germany’s industrial output by 5 billion euros.
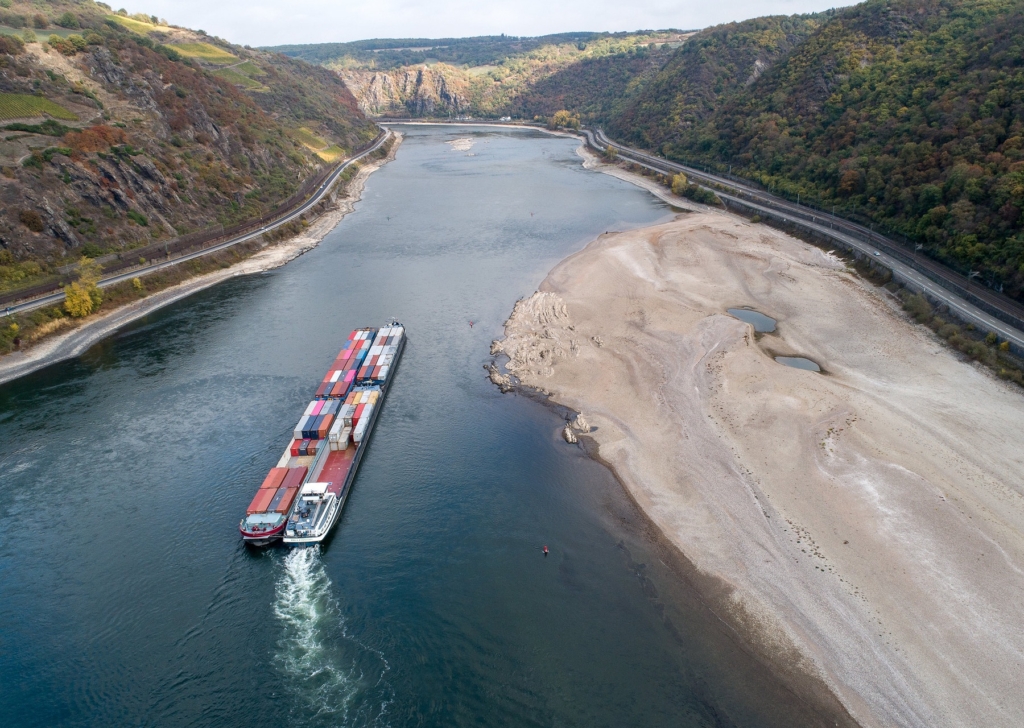
Photos: Bundesanstalt für Wasserbau, licensed under CC-BY 2.0.
This year’s low water event is expected to hit the economy even harder. Bloomberg reports that the operation of coal plants and factories may indeed soon be disrupted due to a lack of supply. Meanwhile, German transport minister Volker Wissing, who keeps failing to reduce the transport sector’s climate impact, has called for the river to be dredged so that cargo ships can continue to pass. The irony here is that many of these ships are actually used to transport coal, oil, and gas, further fueling the climate crisis.
About the data
The map is based on river geometries from OpenStreetMap that I’ve extracted using the Overpass API and processed via Mapshaper. Here’s the Overpass API query, in case you’d like to try something similar.
For the line charts, I used data provided by the German Federal Institute of Hydrology (BfG). Through their data portal PegelOnline, you can download real-time data on water levels for the major German rivers. Unfortunately, that does not include all the historical data I used here. Time series that go further back than 30 days have to be requested individually from their data desk.
Thanks to Olivier Lejeune, who also helped me out with data while I worked on this blog post. If you are interested in data analysis and forecasting about the Rhine’s water levels, check out his project RhineForecast.
As always, do let me know if you have feedback, suggestions, or questions. I am looking forward to hearing from you! You can get in touch with me via simon@datawrapper.de, Mastodon, or Twitter.


Comments