This article is brought to you by Datawrapper, a data visualization tool for creating charts, maps, and tables. Learn more.
Run Fabian Run


Hey everyone! Before you start reading, let’s do some jumping jacks, stand up from your office chair, stretch and walk around a minute, it’s healthy. I’ll wait here. I’m Fabian, software engineer at Datawrapper and in charge of this weeks’ Weekly Chart.
In August this year, I was on vacation in Scotland and realized that I should do something for my health. As a teenager, I played table tennis in a club. Since graduation, I haven’t done that many fitness related activities though. I noticed more and more that my stamina declined and wanted to change something.
In September I got some running shoes and started running in intervals. I wanted to take it slow, since I had no real goal. I wanted to run and increase duration, speed and distance over time. My first run included intervals of 1 minute running and 1 minute walking until the timer hit 20 minutes. At my own pace, I would increase intervals per run to 2 minutes, 3 minutes, until I ran the whole 20 minutes. This is where I’m at now (actually I’m at 25 minutes but that happened only last week). During these months I wore a fitness tracker to see my progress. This is where charts come into play.
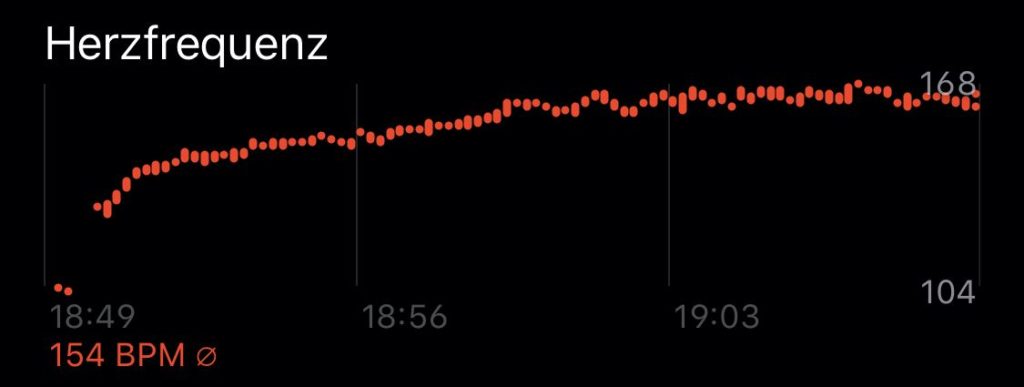
Looking at my heart rate during workouts always looked interesting to me. Running in intervals gave a nice zig-zag pattern of increasing (during running) and decreasing (during walking) heart rates. This is pretty obvious if you think about it, but it was fun to see in the data. Over time the zigs and zags disappeared until I hit 20 minutes running. In my fitness app I could only see heart rates for one run at a time and thought it would be fun to visualize them in one chart. That’s what you are looking at below ⬇️.
A huge cloud of dots. Interesting, isn’t it? Well, not really, but at the bottom you can kind of see the zig-zag pattern I was talking about. Let’s look at the same data with some highlights:
This is much more interesting. I highlighted my first run, a run where I was faster and a run that felt nice and comfortable. The heart rate measurements looked interesting and proved my assumptions about the workouts. Heart rate decreases when resting and increases when running faster. What a surprise! To see the decline in zigs and zags, I made a table which contains every run:
This is a personal project of mine and I want to continue running in 2020. The next goals are 30 minutes running, 5 kilometers distance and maybe both in one run.
That’s all in terms of my data and now I want to write some more about the process of getting it out of my fitness tracking app.
I’m using an Apple Watch to track runs and check them in Apple’s Health or Activity app. The Health app has a feature to export your data as a .zip file. Extracting that file gives you a bunch of text files with data represented in XML format. After parsing it and converting to CSV, I did find the heart rate measurements, but not during the time that I worked out. I looked around in all exported files and did not find heart rates that were measured during my runs. I’m still not sure if they are just not included or if I didn’t look in the right place. If you know more about that, please let me know!
I knew the data was there because I could look at it in the Activity app.
After some googling I found an app called RunGap that could export my workout data in the .fit format. The next task was converting these .fit files into CSV and extracting the data that I wanted. I’m most comfortable programming in JavaScript and a quick search on NPM returned the quantified-self-lib (link), which parses .fit files. I copied the code example from its documentation and started converting:
const fs = require('fs')
const { QuantifiedSelfLib } = require('quantified-self-lib')

const file = fs.readFileSync('my-workout.fit')

QuantifiedSelfLib.importFromFit(file).then(event => {
  const data = crunchNumbers(event)
  console.log(data)
})
Running node script.js > my-workout.csv saves the data, which can be copy-pasted to app.datawrapper.de or uploaded with Datawrapper’s API.
Assuming you own an iPhone, you can apply this approach to visualize all kinds of health data. Your phone is probably already counting steps. The next time you want to visualize some data it might be waiting in your pocket!
Thank you for reading my little story. This is the end. Maybe I encouraged someone to start working out or set a New Year’s resolution to get fitter. Whatever you do, have a great new year! If you want to know more about the data collection or anything else, don’t hesitate to ask me on Twitter @sto3psl.


Comments