


We’re hiring a UI / UX designer with experience in data visualization
June 28th, 2024
6 min
This article is brought to you by Datawrapper, a data visualization tool for creating charts, maps, and tables. Learn more.

It’s turning chilly in Berlin — but here in our office, it’s only getting cozier. We’re very happy to announce that we’ve doubled the size of our design team by hiring Alexander Käßner. He’ll join our head of design, David Wendler, to work five days a week on the interface and user experience of Datawrapper’s app and website.
Hi, my name is Alex. I’m a software designer originally from Dresden, now living in Berlin. When I’m not on my couch playing games or scrolling through cat memes, I really enjoy going for a run outside, exploring the city by foot, or playing beach volleyball with friends.
After finishing my bachelor’s degree in interface design at the FH Potsdam, I jumped straight into designing Mac app interfaces and app icons.
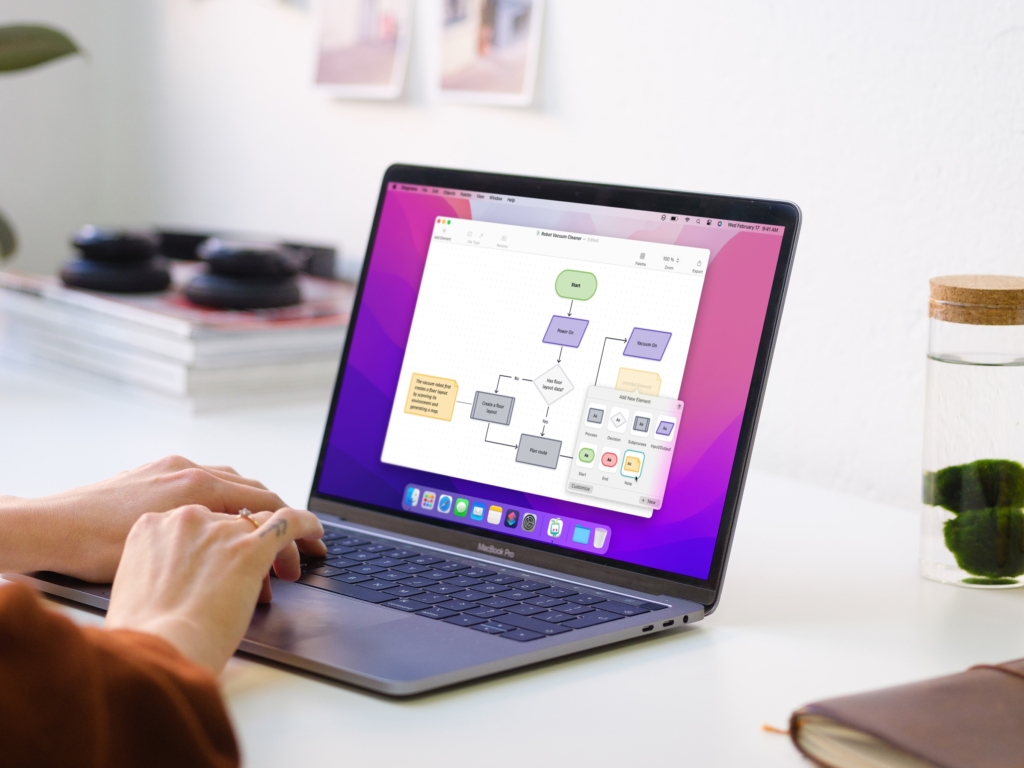
I had already designed and developed apps in my free time as a student, but my first full-time job was working as a designer on a flowchart design tool for Mac.
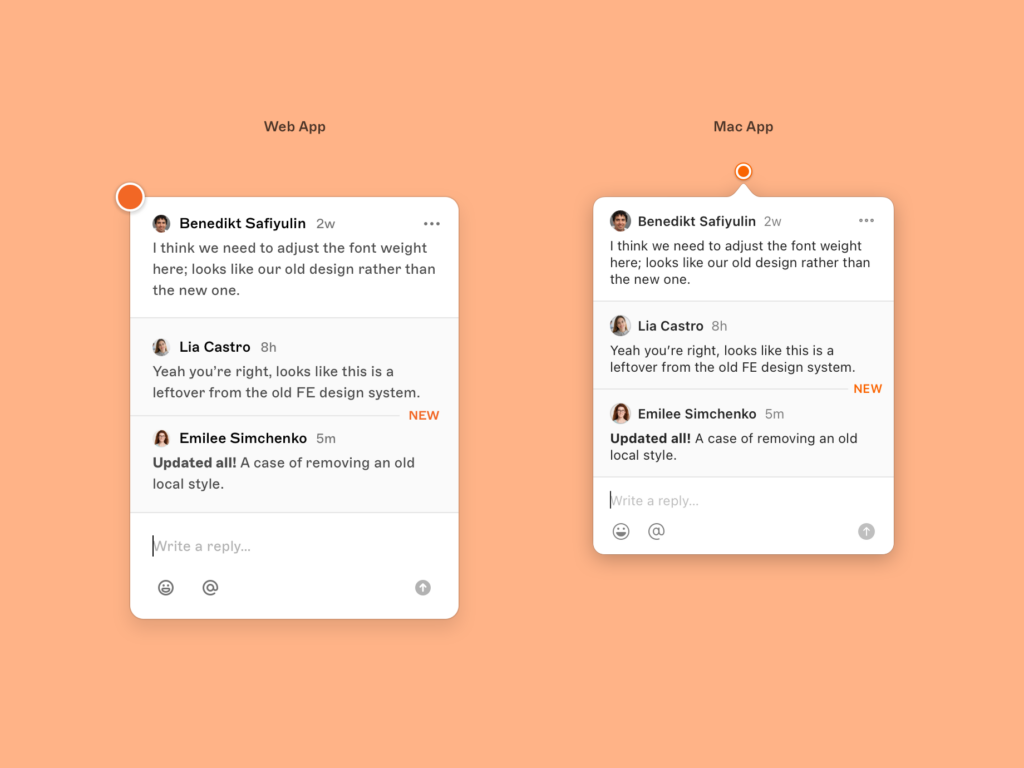
After two years there, I joined the product designers at Sketch, where I became part of a team designing features for the Mac and web apps.
Unfortunately I was part of a big layoff at Sketch, but I took the opportunity to extend my coding skills further and learn SwiftUI by working on smaller apps. The biggest project I worked on was an app whose idea I had in the back of my mind for a while: MeterStats.
MeterStats is an app that helps you keep track of readings for your gas, heat, and water meters. My goal was to create an easy way to input the readings and have the app do the rest by calculating consumption over time. And, of course, I added a lot of charts to better visualize the trends and patterns.
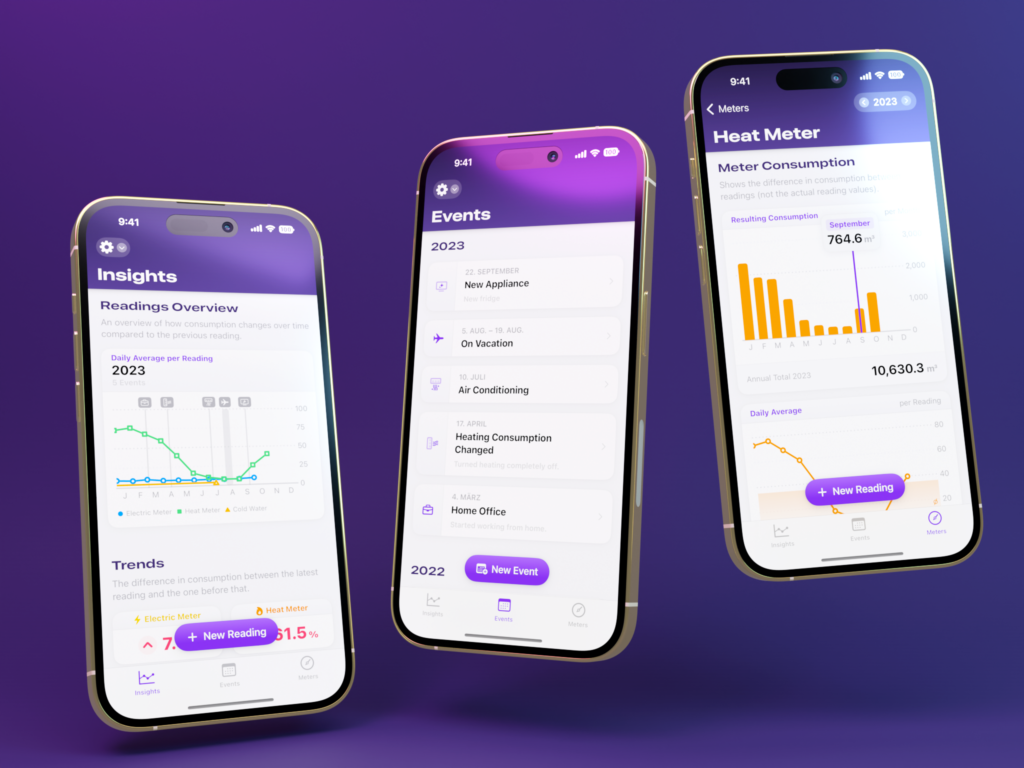
It’s an app I’m really proud of. Not only did I design and develop it myself while learning a new coding language, but I personally use it on a regular basis. In fact, my own need for it is how the idea came to me in the first place. If you also like to keep an eye on your energy consumption, feel free to give it a try.
Sure! Here’s one: For my bachelor’s thesis, I created a concept design for a main menu on the iPad. My research goal was to make professional iPad apps easier to use. I really enjoyed digging deep into the history of main menus (truly an ancient UI component!) and exploring ways to bring them to touch interactions.
After working on my own projects, MeterStats, and other smaller apps for almost a year, I felt it was time for a change. And ever since university, I had wanted to work more deeply on the topic of data visualization.
Once I saw the job posting for a UX designer at Datawrapper, it immediately sparked my interest. Being able to combine my expertise in software design and my interest in data visualization sounded great. Besides, I’ve always liked to work on tools that allow people to do complex things easily — and Datawrapper does just that. I had to apply.
Being a visual learner myself, I’ve always had a strong interest in information visualizations. I loved digging into the detailed graphics of the National Geographic magazine as a teenager.
During my studies I learned how fun and fulfilling it can be to create data visualizations myself, and came to strongly believe that showing data visually is the best way to teach and inform people about many topics. I’m happy to finally contribute to bringing this field to more people.
Welcome, Alex! To learn more about Alex, visit his website, alexkaessner.de.


Comments