We’re hiring a Werkstudent*in Social Media & Communications
October 15th, 2024
4 min
Datawrapper lets you show your data as beautiful charts, maps or tables with a few clicks. Find out more about all the available visualization types.
Our mission is to help everyone communicate with data - from newsrooms to global enterprises, non-profits or public service.
We want to enable everyone to create beautiful charts, maps, and tables. New to data visualization? Or do you have specific questions about us? You'll find all the answers here.
Data vis best practices, news, and examples
250+ articles that explain how to use Datawrapper
Answers to common questions
An exchange place for Datawrapper visualizations
Attend and watch how to use Datawrapper best
Learn about available positions on our team
Our latest small and big improvements
Build your integration with Datawrapper's API
Get in touch with us – we're happy to help
This article is brought to you by Datawrapper, a data visualization tool for creating charts, maps, and tables. Learn more.

If you’ve ever been stuck using Datawrapper, or had a question about the app that you couldn’t find the answer to in our Academy, then you know about our support team. We’re delighted to announce the latest addition to that team: Ceren Dolma is joining us remotely from Belfast, Ireland.
Let’s get to know her:
Hi! My name is Ceren (the ‘C’ is pronounced like a ‘j’, think ‘Ja-Ren’). I am originally from Turkey, and have moved through the Netherlands, U.S., Denmark, Germany, and Austria before setting a steady foot in Belfast, which is where I’m based at the moment.
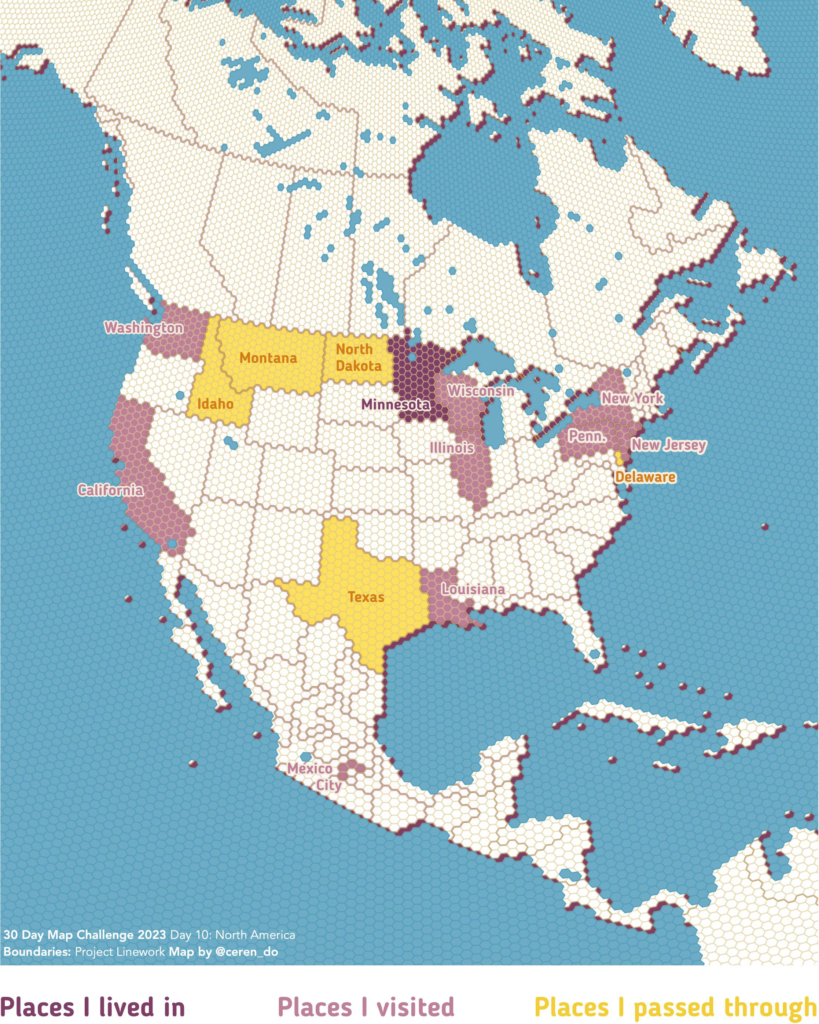
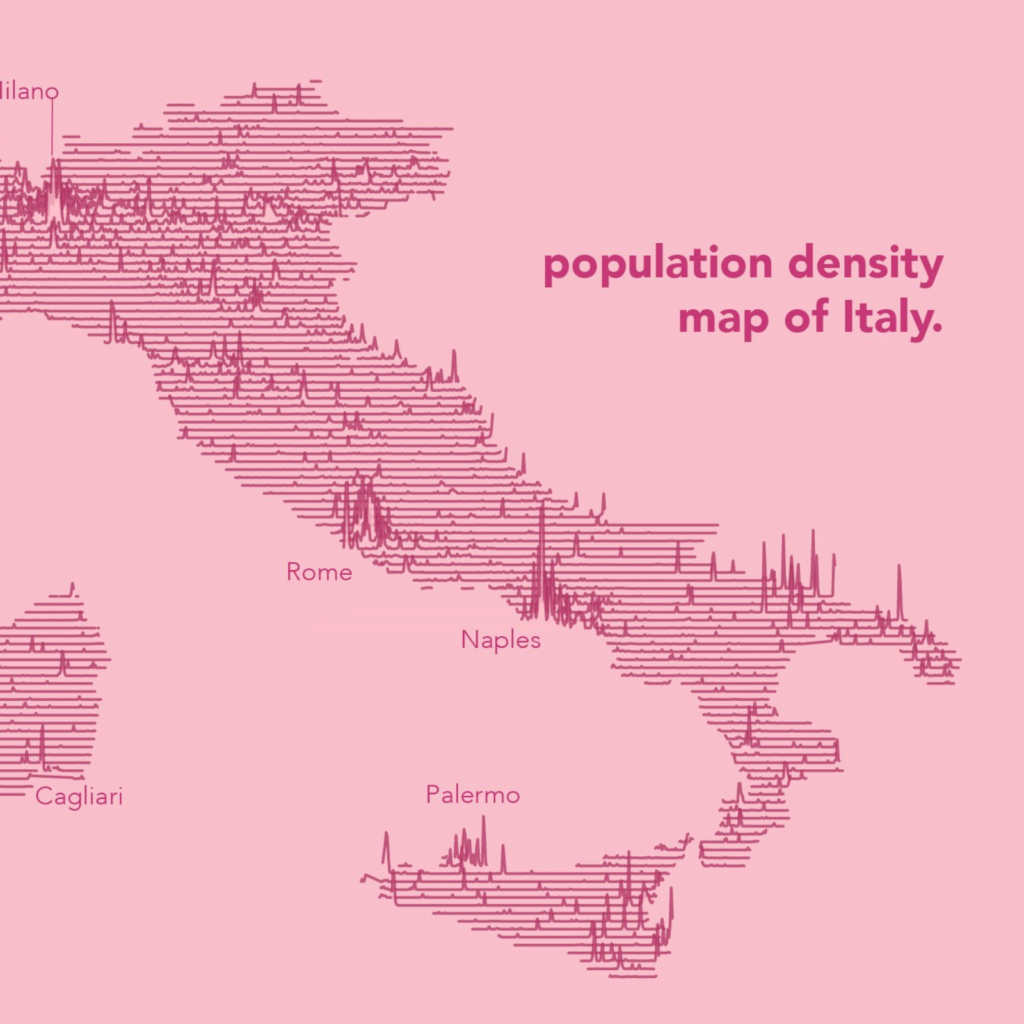
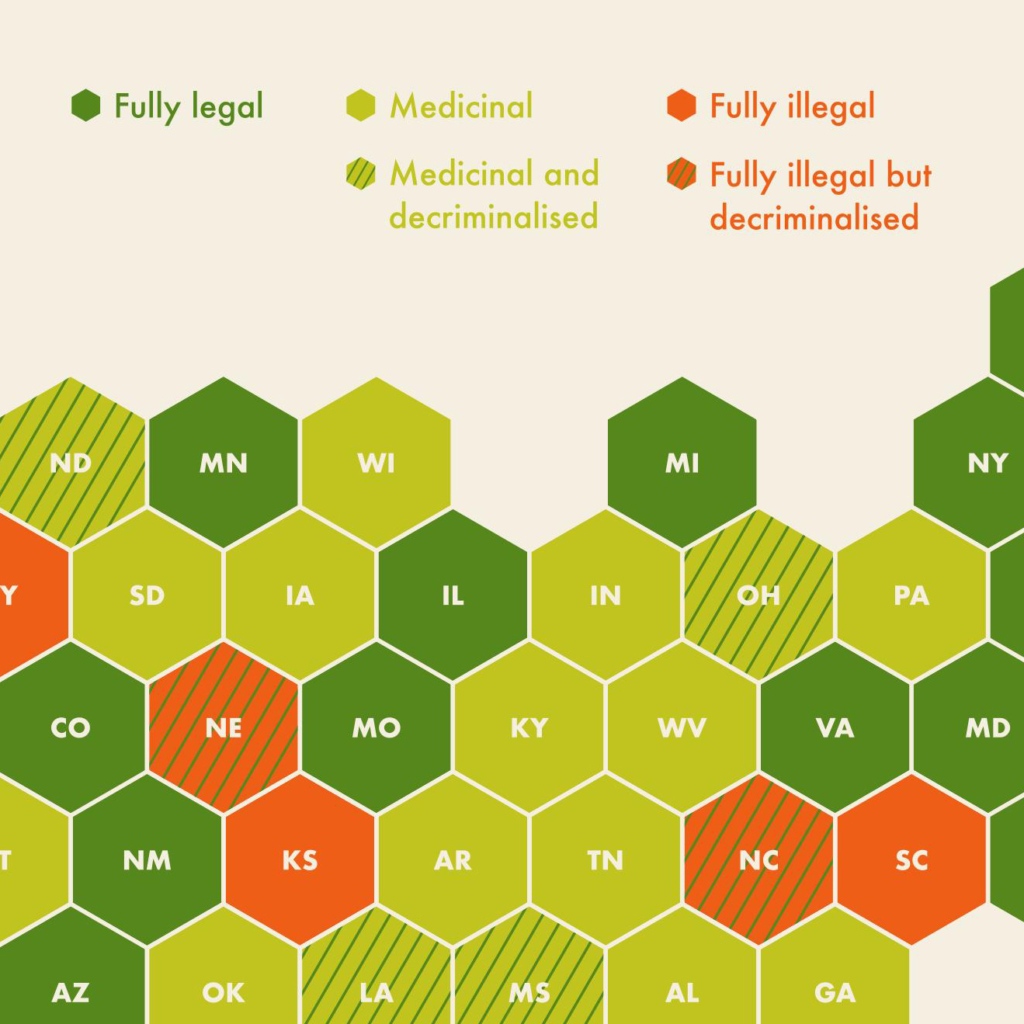
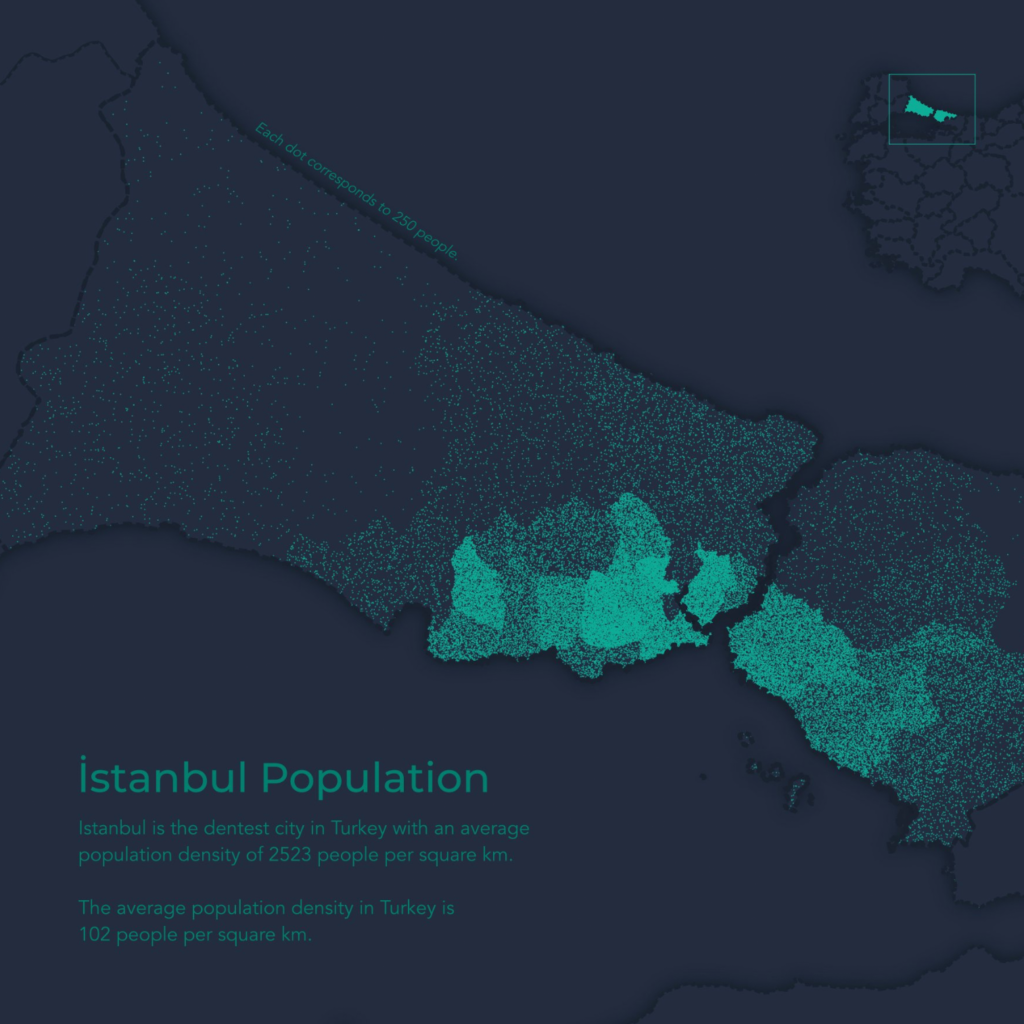
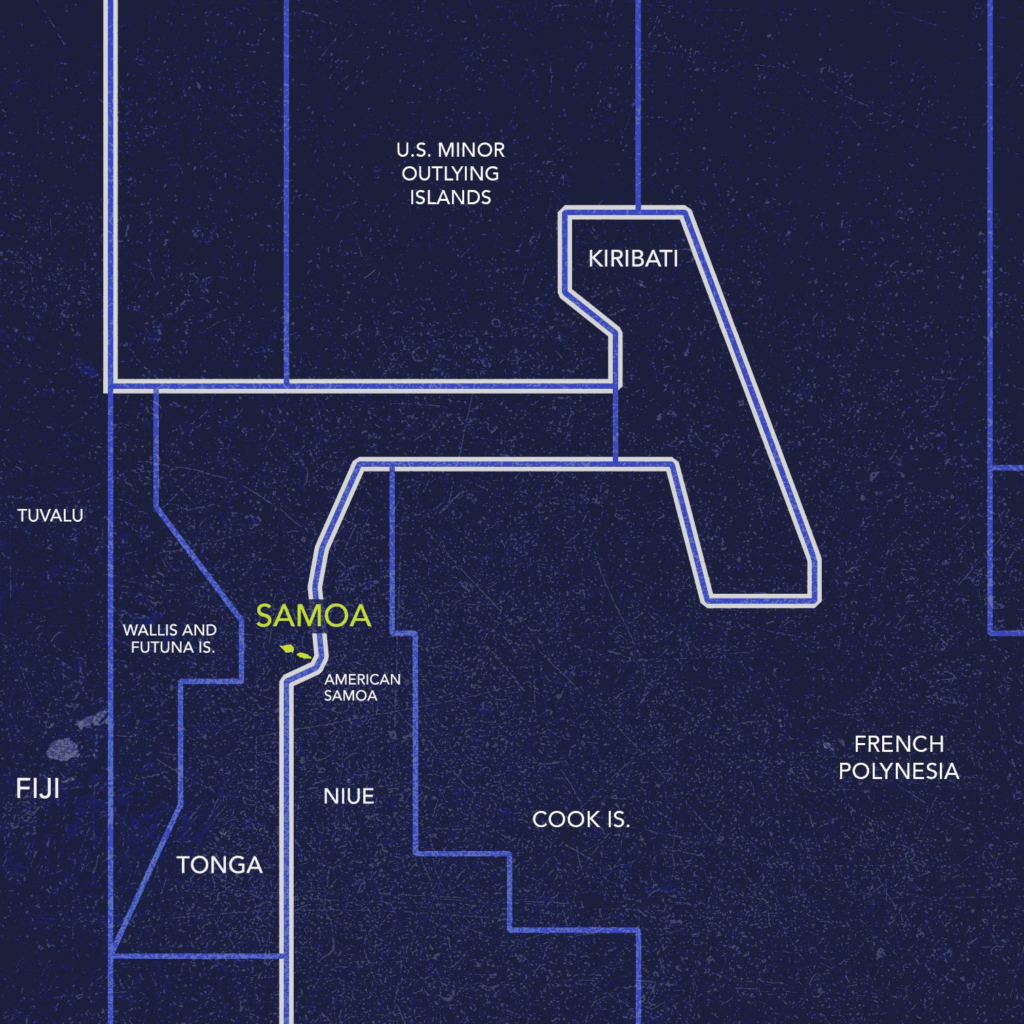
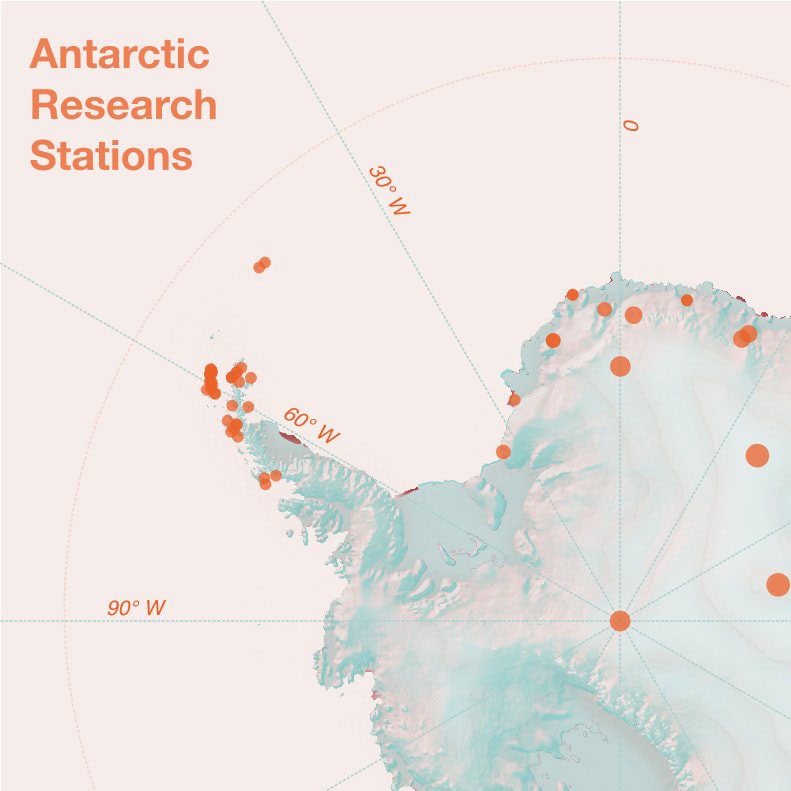
My background is in geography and cartography. Shortly after finishing my master’s degree in the field, I got a job as a GIS consultant where I helped build custom solutions for clients who worked with large spatial databases.
During this time, I noticed I wanted to work more with maps and other visualisation types as communication tools, as I found myself most animated when I was working on projects that focused on making a point or getting a message across.
I stepped away from the GIS consultancy role to explore alternative paths and gain new skills, and this lead me down a freelancer path where I wore many hats as a yoga teacher, admin assistant for a street art collective, and map designer for an atlas.
As a cartographer, I was first introduced to Datawrapper through its mapping capabilities. As I shifted my focus towards data visualization at large, I also started spending more time using the resources Datawrapper makes publicly available and became an eager follower of Weekly Charts and the Data Vis Dispatch. I was fond of Datawrapper for its genuine effort to improve the overall quality of data visualizations out there by making an accessible tool with low barriers to entry. Having spoken at the Unwrapped conference earlier in March cemented my interest in joining the company, so I decided to apply for the support role — and here I am 🙂
At Datawrapper, I will be joining Margaux, Michi, and Shaylee to be one of the many friendly voices that get back to you when you reach out to support@datawrapper.de. Whether you are having trouble with your account, or are curious if you can accomplish something you have in your mind using Datawrapper, don’t hesitate to give us a shout!
Thanks, Ceren! We’re excited to have you as part of the team. To learn more about Ceren, visit her website or find her on X and LinkedIn.
Comments