

We’re hiring a UI / UX designer with experience in data visualization
June 28th, 2024
6 min
This article is brought to you by Datawrapper, a data visualization tool for creating charts, maps, and tables. Learn more.

With over 4000 basemaps and counting, our cartography team is busier than ever. And now it’s growing! We’re excited to welcome Eleni Tsagkaropoulou, who joins us part time as a working student in our Berlin office to enrich and expand Datawrapper’s map offerings. We sat down to ask Eleni a few questions.
Hiii! My name is Eleni.
I spent my childhood in Athens with my family and then spent the next couple of years on the island of Lesvos, where I pursued my bachelor’s degree in environmental science. During my studies I explored various scientific fields, worked in the lab, held bats, flamingos, robins, and rats, counted thousands of olive trees, and eventually found myself becoming curious about maps!
The circus! I felt the need to take a break from academia after completing my bachelor’s degree, so I moved to Berlin and joined a circus association, where I started self-training in aerial acrobatics and sewing costumes for my friends’ performances.
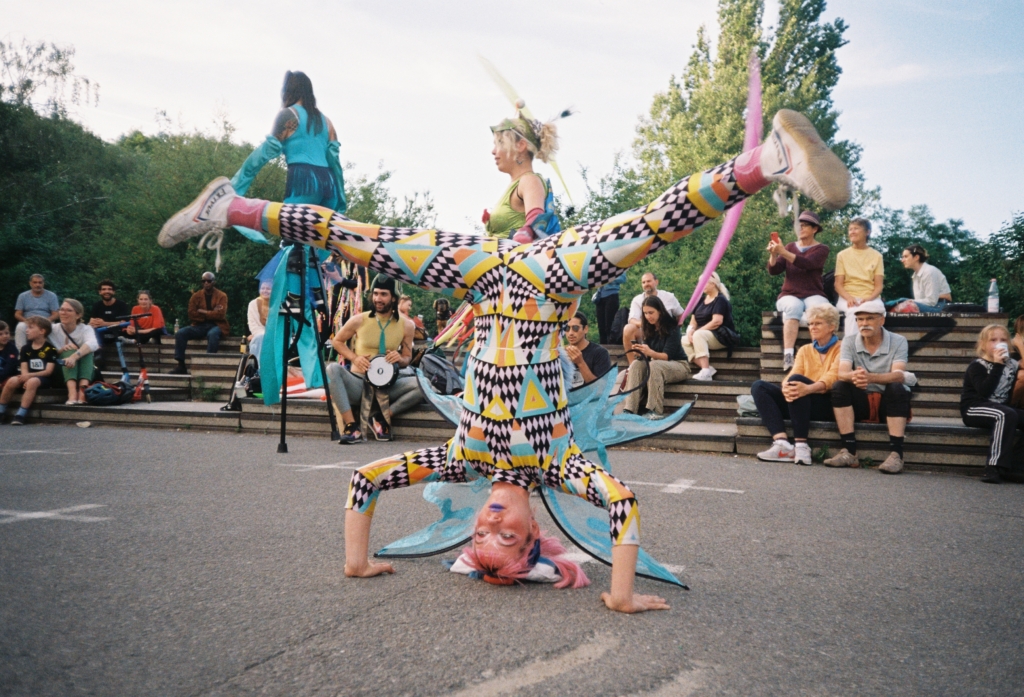
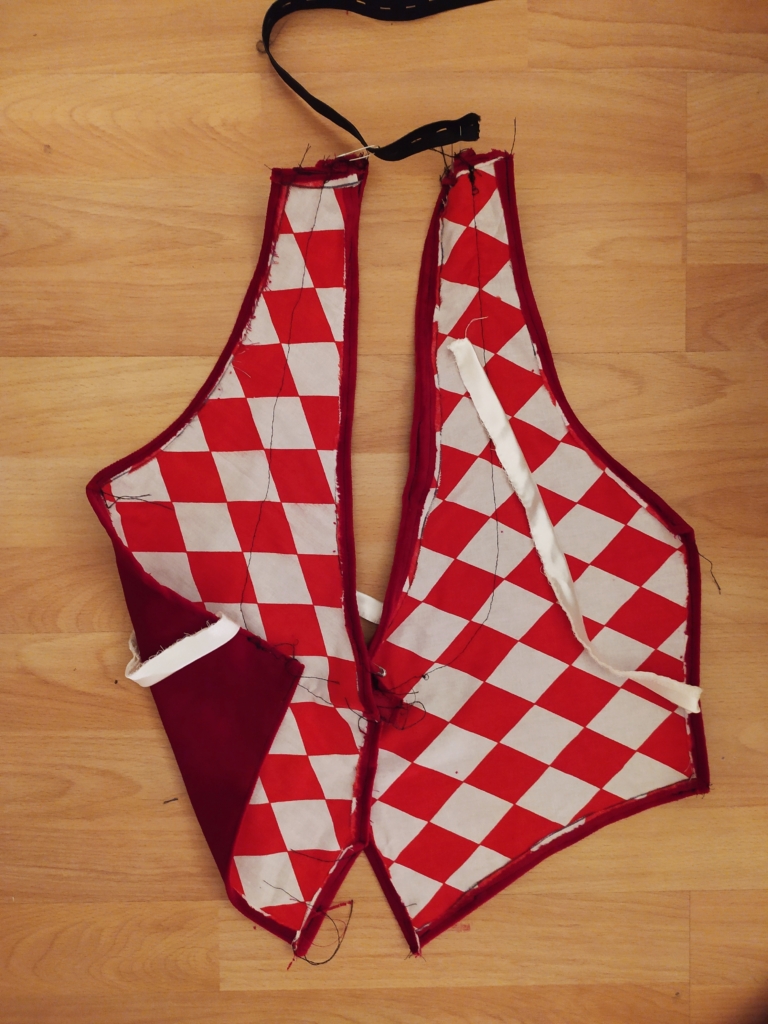
Currently, I’m a master’s student in global change geography at Humboldt University. Now I can only find time to knit costumes on the S-Bahn in between work and uni.
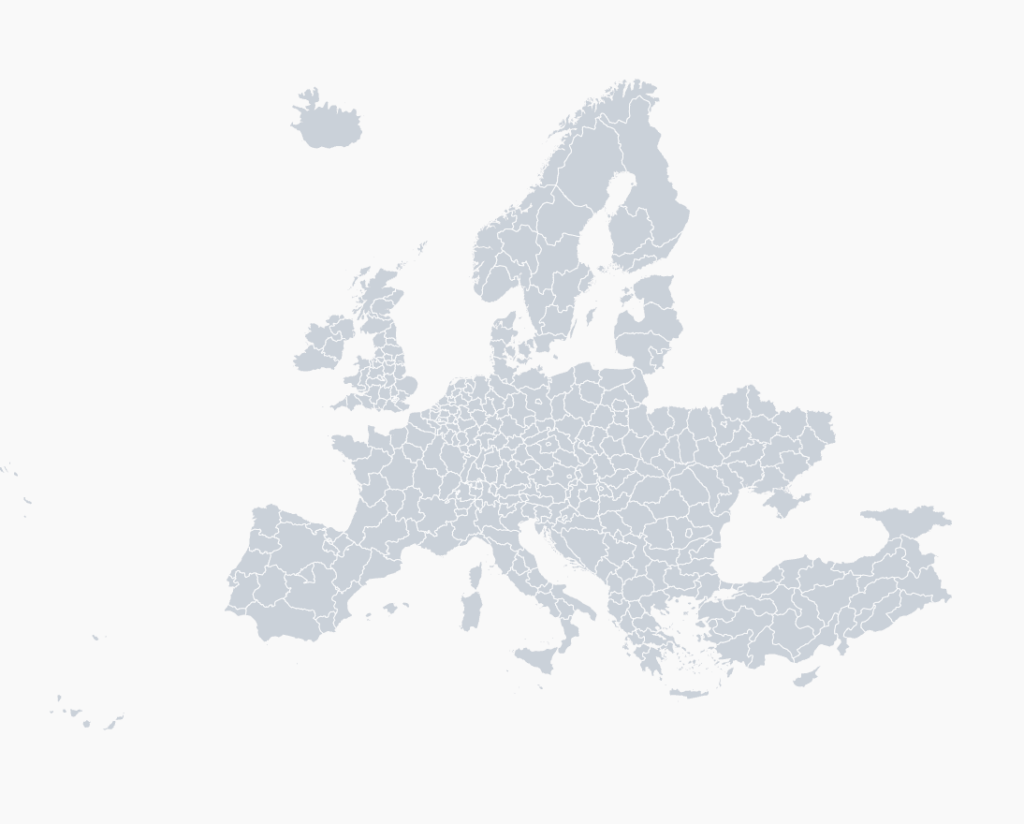
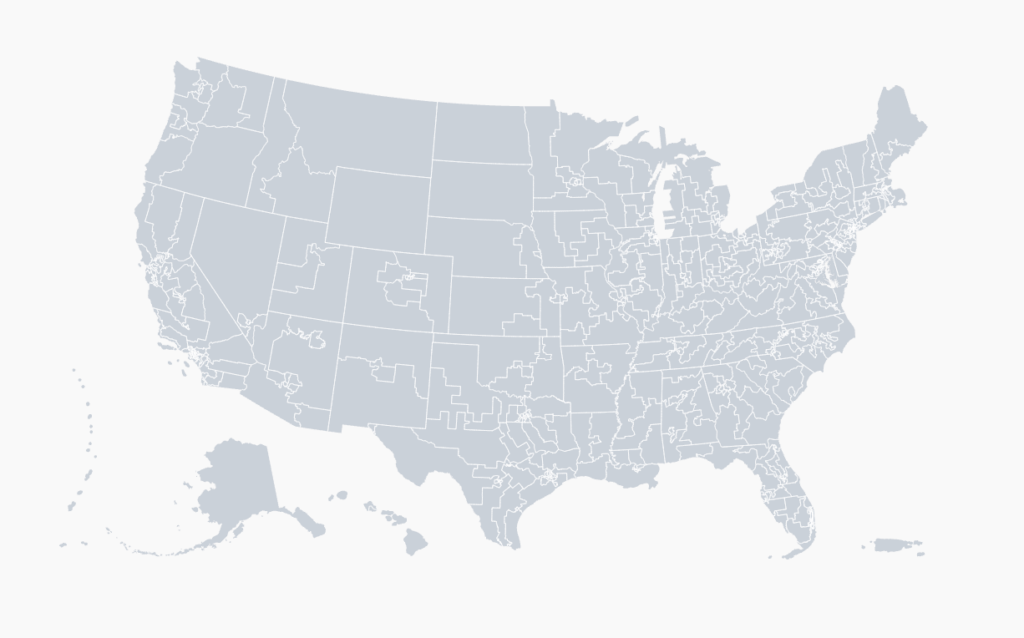
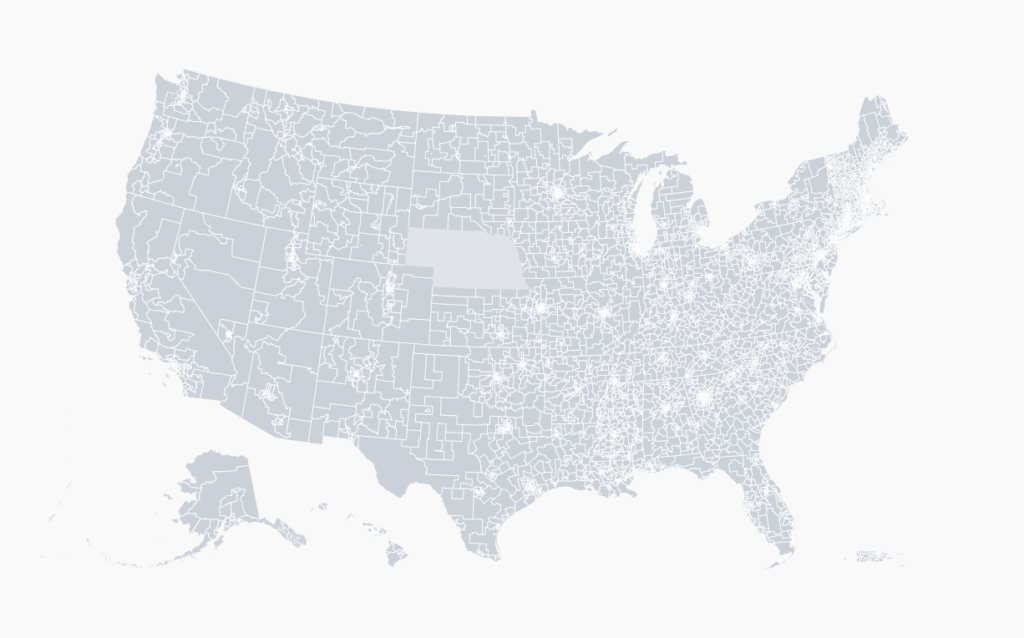
I’m working to enrich Datawrapper’s library of choropleth and symbol basemaps. My main goal is to assist users by identifying and creating the most suitable maps for their projects. You have a request for a new basemap? Send me an email and I’ll try my best to make your wish come true! Below are some of the requested maps that I’ve created with my colleague Anna so far:
When I read the job description, I felt that it was a perfect fit both with my educational background and with the company’s culture.
Diving into the blog, I fell in love with the Weekly Charts and the Map Stories, especially the fact that all employees contribute to these mini-articles whatever their professional background. The idea of working alongside this team, expanding my knowledge, being mentored by Anna, the master of choropleth maps, and sharing my interests through writing articles, is genuinely exciting to me. It make me SO happy every time I receive an email with kind feedback about our support team!
I believe in bringing scientific tools to a broader audience, whether it’s journalists, students, or simply anyone who wants to communicate information. Datawrapper’s product is a great example of this, which was a further reason that made me want to join the team.
I am always proud of my bachelor’s thesis — not only because of the final outcome but also due to the process, since it took place during the COVID-19 pandemic. It took me more than a year to complete the data collection from the field, and there were many challenges to overcome along the way.
For example, I had this very traditional habit of keeping all of my field measurements in a notebook instead of transferring them immediately to a virtual file. And of course… I lost the notebook. Every lesson is learned the hard way.
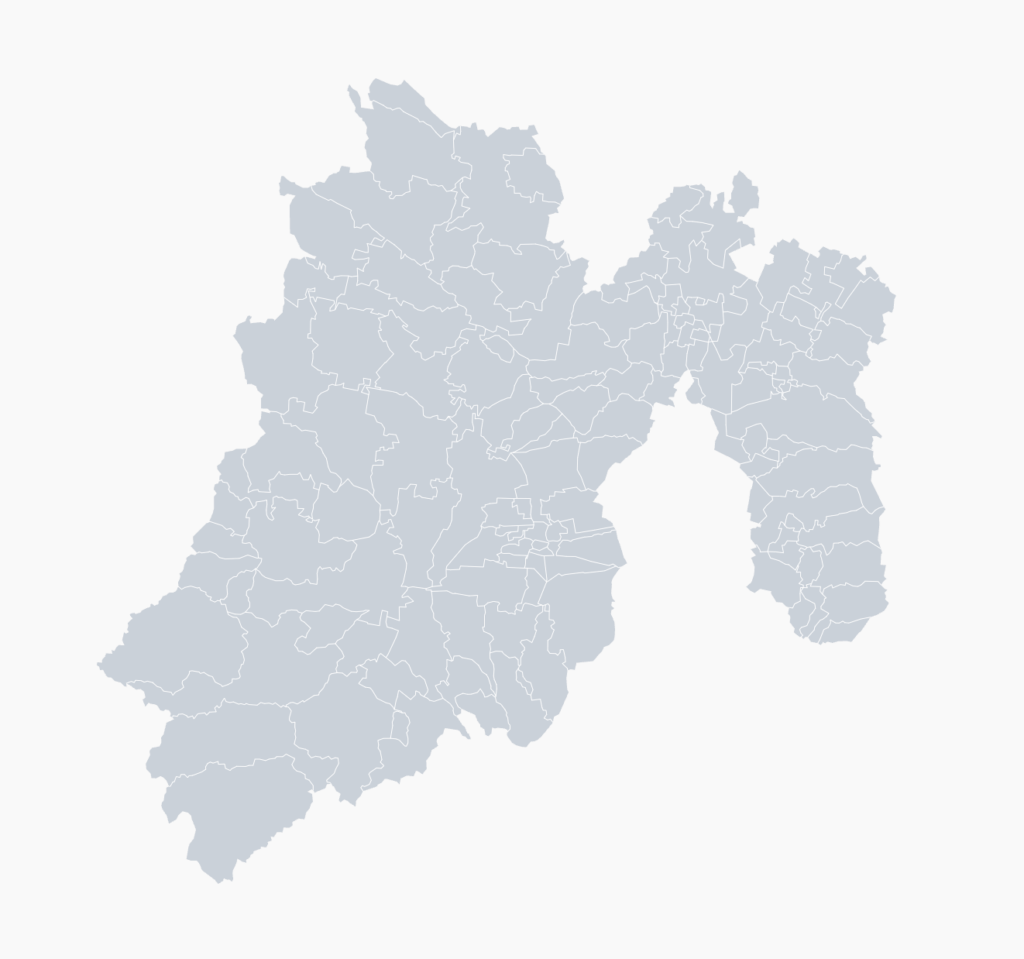
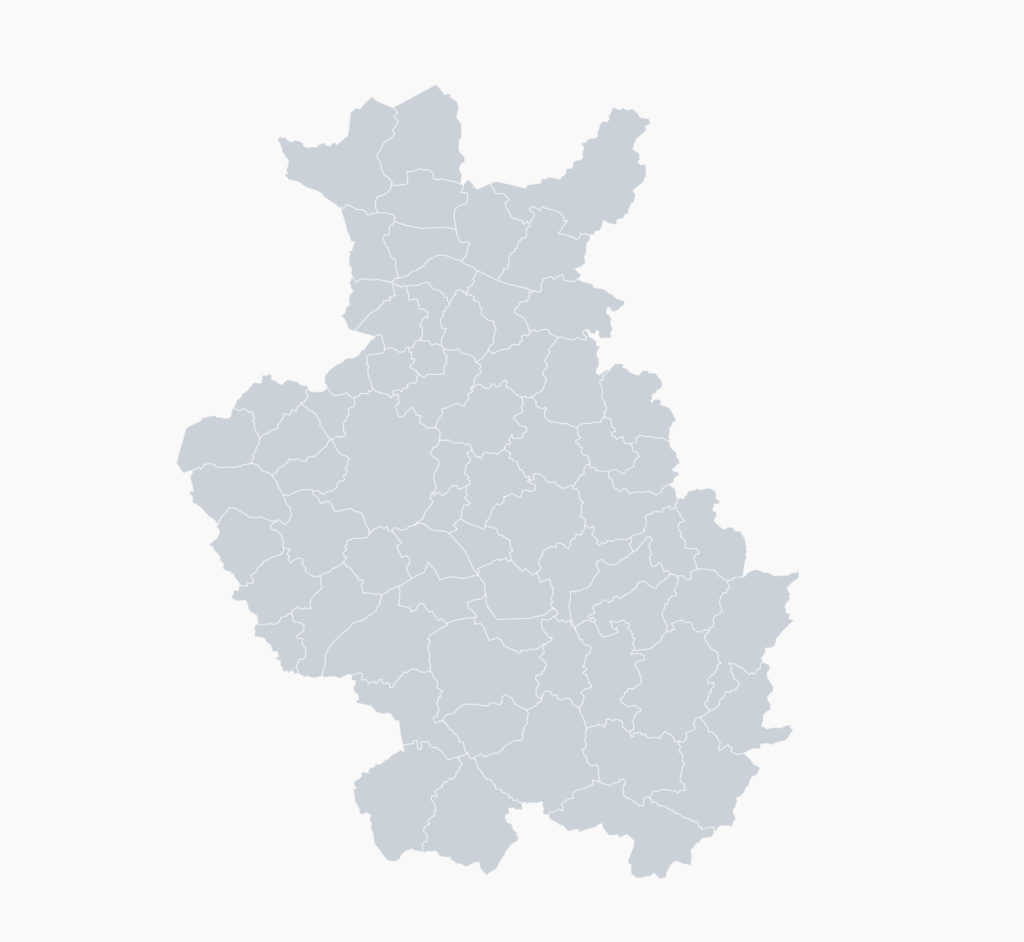
My thesis presented a land management proposition for local farmers, advocating sustainable intensification tailored for olive groves. I combined field measurements with satellite data to calculate the biomass of olive groves on Lesvos, using an approach based on spatial data and biometric parameters like altitude, ground slope, and spacing between trees.
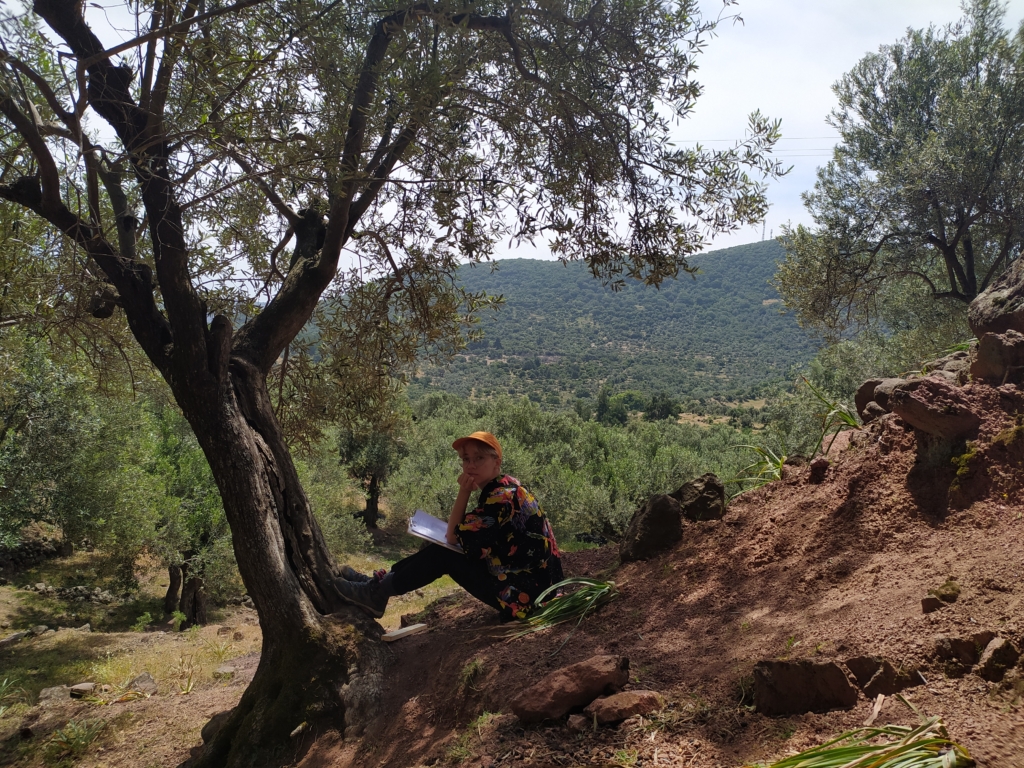
At that time in Greece, it was prohibited to travel far from home in order to prevent the spread of the virus. That was funny, because my fields were literally in the middle of nowhere, but I guess the pandemic period was bizarre in many ways. I’m sure many former students who had to conduct research during this period can relate.
The green points on this map represent the locations of our field samples. At each location, there are dozens of olive trees that required a variety of measurements. As you can see, my peers and I did quite a bit of traveling around the island in my beloved 90's Starlet. We had to jump a lot of fences and convince the farmers that we were coming in peace. I will never forget the day we got chased by a furious donkey, tried to escape with the car, running full speed in a downhill! Good times!
Welcome, Eleni! We're so glad to have you with us.


Comments