We’re hiring a Werkstudent*in Social Media & Communications
October 15th, 2024
4 min
Datawrapper lets you show your data as beautiful charts, maps or tables with a few clicks. Find out more about all the available visualization types.
Our mission is to help everyone communicate with data - from newsrooms to global enterprises, non-profits or public service.
We want to enable everyone to create beautiful charts, maps, and tables. New to data visualization? Or do you have specific questions about us? You'll find all the answers here.
Data vis best practices, news, and examples
250+ articles that explain how to use Datawrapper
Answers to common questions
An exchange place for Datawrapper visualizations
Attend and watch how to use Datawrapper best
Learn about available positions on our team
Our latest small and big improvements
Build your integration with Datawrapper's API
Get in touch with us – we're happy to help
This article is brought to you by Datawrapper, a data visualization tool for creating charts, maps, and tables. Learn more.

Never before did so many people join our team in one month: We grew from 23 to 26 people in October! One of them is our new full-stack developer Julian Freyberg, who will work full-time from Frankfurt on our app team. Let’s ask him a few questions to get to know him better:
Hey, I’m Julian! Born and raised in Heidelberg, I recently moved to Frankfurt and just started working remotely at Datawrapper. When I’m away from my keyboard, I enjoy going to the gym, cooking and tasting all kinds of food, and learning about economics or cinematography (i.e., watching movies).
I always loved building things. It started with a passion for LEGO bricks and quickly turned into one for building web applications. At university, I developed a second passion: data science. Ever since, I’ve tried to get involved in projects that combine full-stack development and data science.
Before starting at Datawrapper, I contributed to a data science initiative at my university called Exploration of Political Information Networks. It’s a giant data collection and modeling project trying to give an overview of the political debate in Germany using networks.
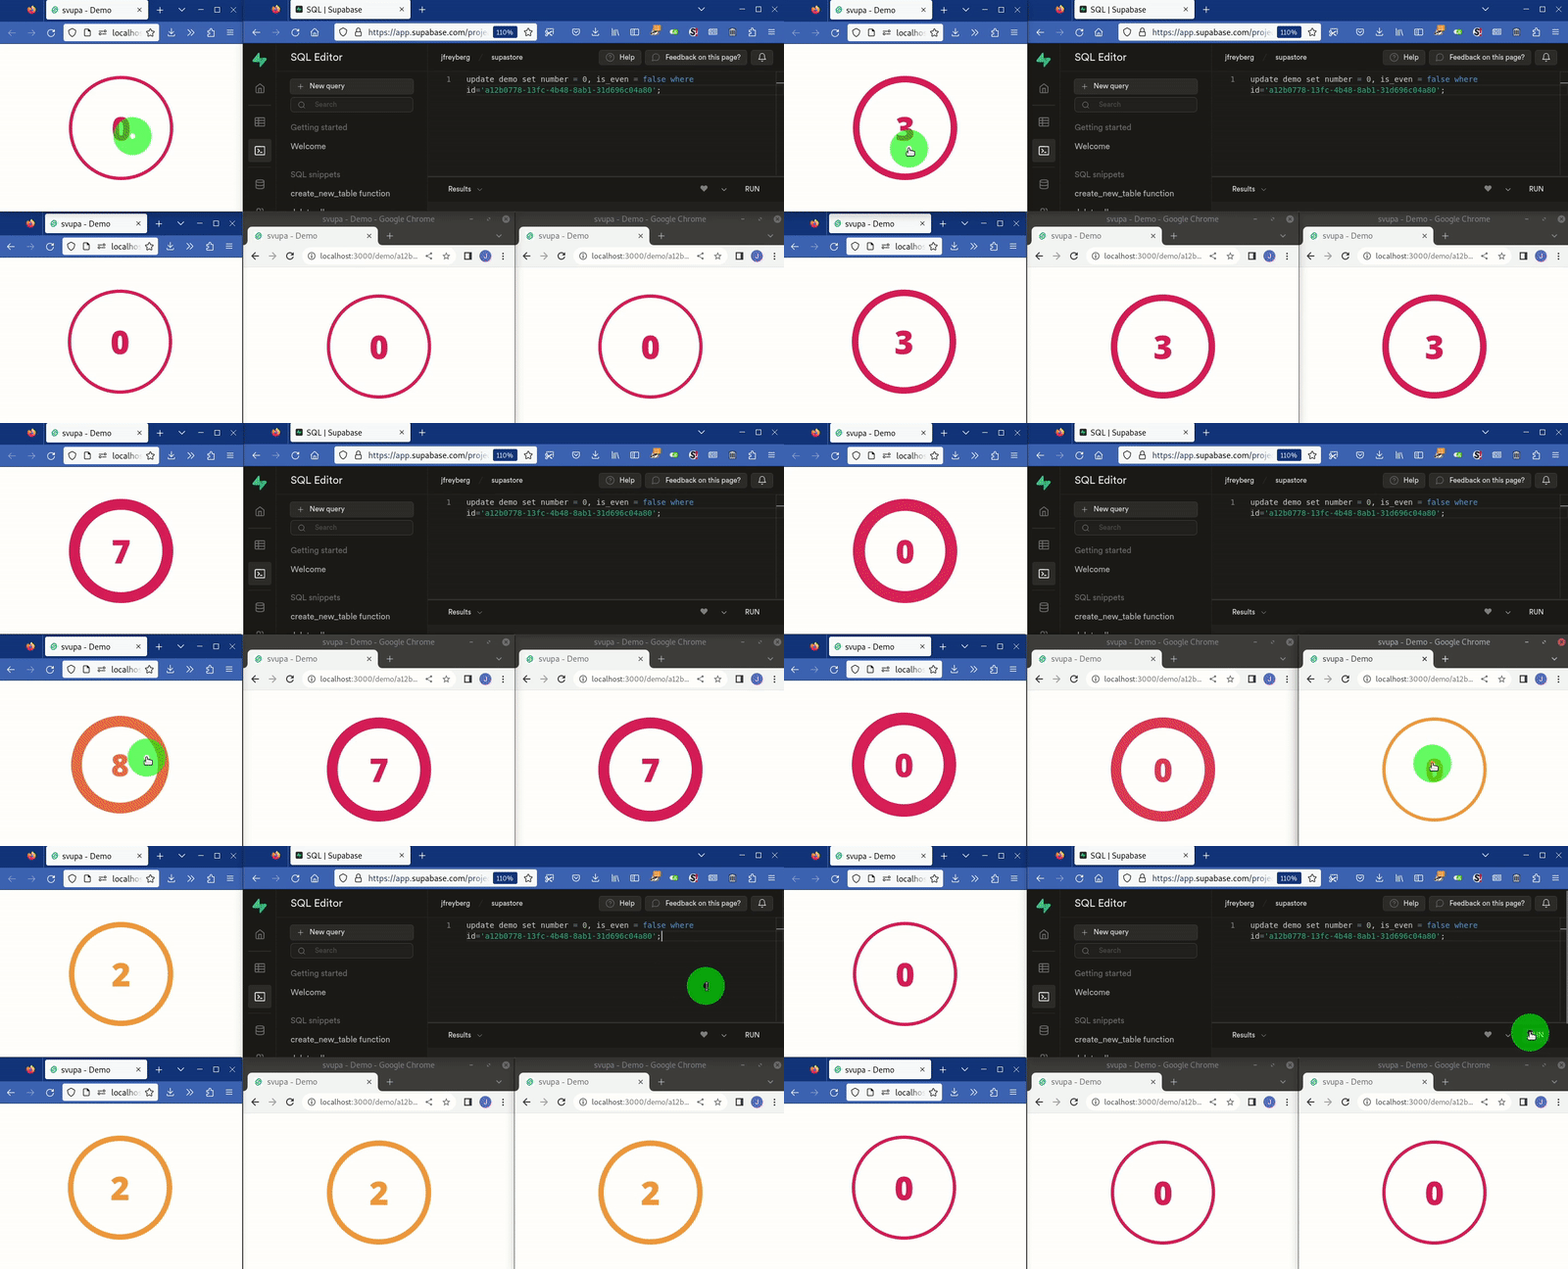
Like most developers, I lost count of my side projects a long time ago. The most exciting ones for me personally are:
Needless to say, both are works in progress.

Datawrapper is located precisely at my personal sweet spot of development and data science. I get to develop a beautiful, modern web application while occasionally mixing in some data-related projects, like creating a new Weekly Chart. It feels great to work on something that you use yourself and really understand the need for. Every time I see a Datawrapper chart nowadays (and they are everywhere), I have a little smile to myself.
Of course, there are other factors too. I was looking to join a smaller company, with a team that supports a flexible, remote-work lifestyle while moving fast and embracing emerging technologies, supporting passionate developers, and encouraging side projects.
As a full-stack developer on the app team, my contributions help to keep Datawrapper up, running, and improving. This includes making updates and adding features that users can see on the frontend, but also improvements behind the scenes that reduce load on servers or make life easier for the team. If, in the future, you encounter any new feature (or bug) in the app, it might very well be the case that I wrote some of the code that powers it.
I am really looking forward to picking up new skills, learning from my team, and creating many cool new features for our users together. I’m excited to explore new technologies and bring my creativity to the table to (hopefully) make the tool even better.
I’m also looking forward to the Datawrapper Christmas party!
Welcome to Datawrapper, Julian! To learn more about Julian’s side projects — or to play a game of snake! — go visit his website.
Comments