

We’re hiring a Werkstudent*in Social Media & Communications
October 15th, 2024
4 min
This article is brought to you by Datawrapper, a data visualization tool for creating charts, maps, and tables. Learn more.
Datawrapper has two main development teams, the visualization team and the app team. The later is responsible for the Datawrapper editor, team settings, and more – and has many plans for improvements. That’s why we’re excited to announce the app team’s newest member, Linus Aarnio, who joins remotely as a full-stack developer. We sat down with Linus to ask him a few questions.
Hi, I’m Linus! I live in a small autonomous region of Finland called Åland, with my wife and two kids, 7 and 2, who usally keep me busy. In the rest of my free time I like being in nature. During the summer months I go hiking, canoeing, or ride my gravel bike (this spring I’ll participate in my first race!). In the winter I enjoy both cross-country and downhill skiing. I also like reading about new technologies and playing around with them to learn new things.
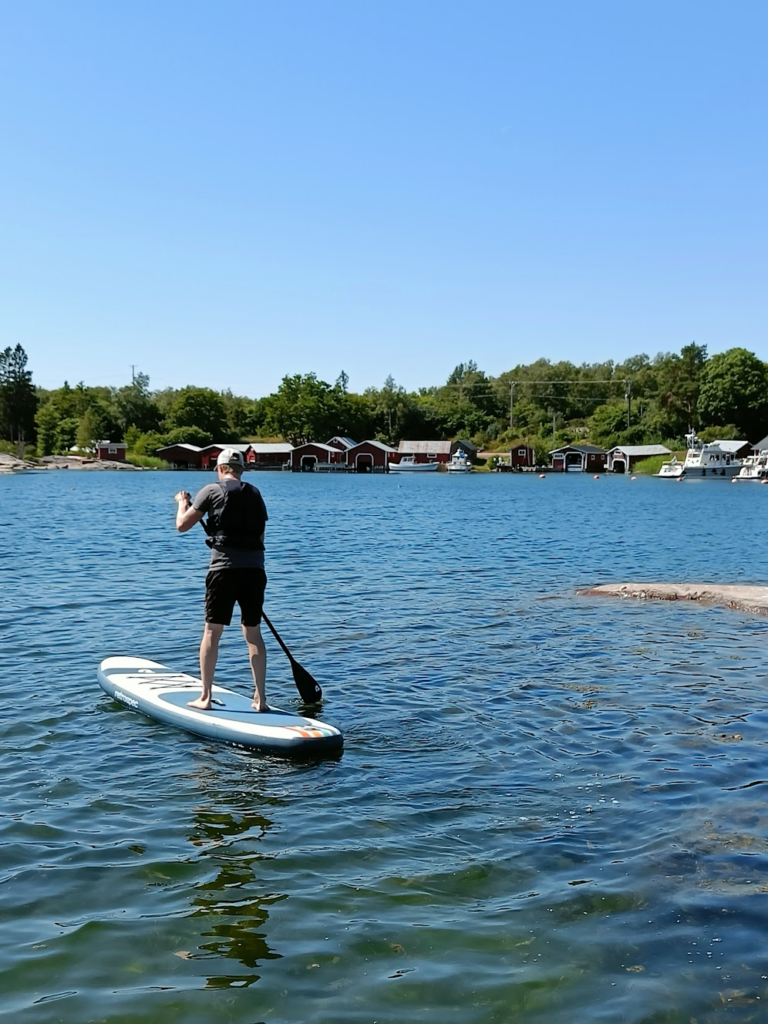
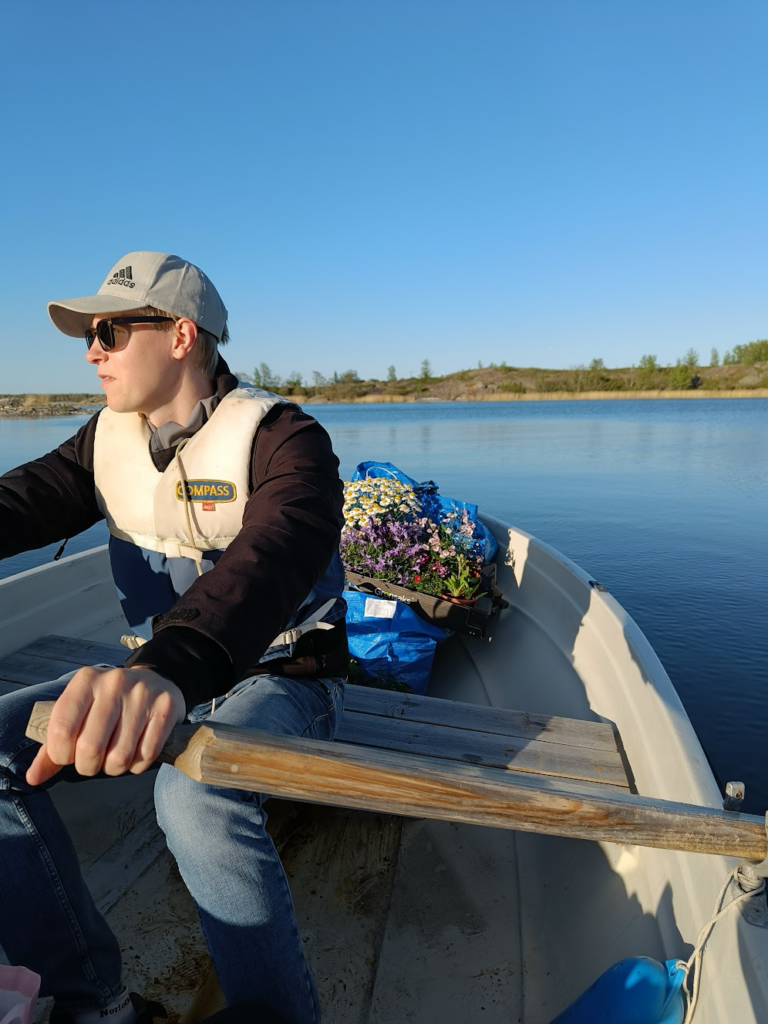
Water is never far away in Åland, and it’s my favorite element during summer:
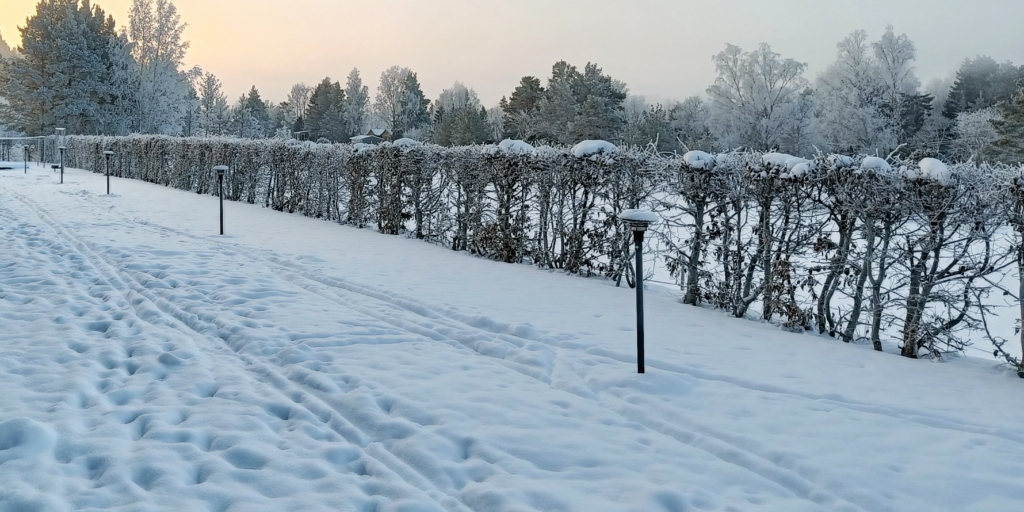
I live in the coldest climate of all Datawrapper employees. Here is the backyard of the house I lived in in January of this year:
I studied Computer Science and Engineering, a bachelor’s and master’s program, at Linköping University in Sweden. During this time I worked as a teaching assistant, helping other students with programming projects and the teaching staff with grading. After that, I worked as a software engineer in a couple of fintech companies, learning a lot about building robust, maintainable software.
I wanted to work in a place where the quality of the product matters to the users and, as cliché as it sounds, has a positive impact on the world. I believe Datawrapper does that, by allowing more people to create great data visualizations. From my previous jobs, I have also found that I thrive in small companies where I can influence the product and experiment with technology. I have always had an entrepreneurial itch, but found that I could scratch it by working in small, high-energy companies. Datawrapper ticked all those boxes, and the blog featuring technical articles and weekly charts created by the staff convinced me that this was a great place to work.
As a member of the app team, I will work on anything in the application that is not the visualizations themselves. This could be improving poor user experience in the team invite flow, fixing bugs, or adding features to allow power users to move or copy charts in bulk. I will also help Datawrapper evolve by making sure the code is maintainable, testable, and secure. Right now, I have jumped head first into developing a new exciting feature with the rest of the team that will be released soon…
I have Hans Rosling to thank for this! His talks and books helped me get a new perspective on the world and opened my eyes to the power of data visualization. I also found, like many others, that visualizations were the only way to grasp what was really happening during the pandemic. I spent a lot of time in the data journalism section of the national news site SVT.
I’ve always worked mainly in backend development and said that I’m incapable of design and avoided anything visual or involving CSS. I have no choice here, but there are so many people at Datawrapper with amazing design and CSS skills that are really helpful. I now find this fun and am excited to learn more about this part of our craft! I am also looking forward to learning more about how to create good data visualizations myself.
Welcome, Linus! We’re so glad to have you with us.


Comments