We’re hiring a Werkstudent*in Social Media & Communications
October 15th, 2024
4 min
Datawrapper lets you show your data as beautiful charts, maps or tables with a few clicks. Find out more about all the available visualization types.
Our mission is to help everyone communicate with data - from newsrooms to global enterprises, non-profits or public service.
We want to enable everyone to create beautiful charts, maps, and tables. New to data visualization? Or do you have specific questions about us? You'll find all the answers here.
Data vis best practices, news, and examples
250+ articles that explain how to use Datawrapper
Answers to common questions
An exchange place for Datawrapper visualizations
Attend and watch how to use Datawrapper best
Learn about available positions on our team
Our latest small and big improvements
Build your integration with Datawrapper's API
Get in touch with us – we're happy to help
This article is brought to you by Datawrapper, a data visualization tool for creating charts, maps, and tables. Learn more.

Hello there!
I’m excited to introduce the newest member of the Datawrapper team — really very excited, because that new member is me. My name is Rose and I’ll be working five days a week as a writer and Lisa’s deputy on the communications team. Normally this post would take the form of an interview, but since this is my wheelhouse it’s only natural that I should “interview” myself. Let’s dive in!
To begin with, I’m not in Berlin (yet).
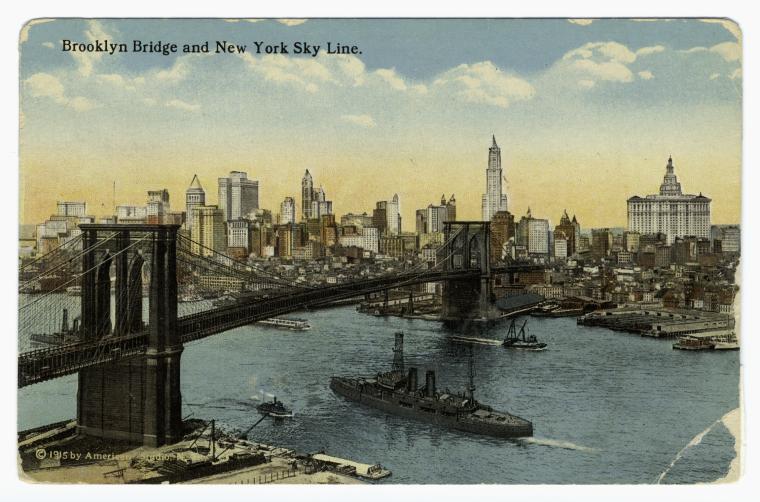
I’m writing to you from New York City, where I was born and raised. It’s also where I’ve spent the past year, going in and out of lockdown while finishing my master’s degree.
When it comes to language, I’ve worn a few hats — linguist, translator, English teacher. And when it comes to other things, well, that’s me too — dabbling artist, amateur designer, calculus teacher. I used to joke that I’m basically interested in words and pictures and numbers.
Before COVID hit, I was living in Edinburgh, studying for a master’s in the evolution of language and cognition. One thing this gave me a lot of experience with is explaining to friends and family what it means to study the evolution of language and cognition. For me, it meant researching how people learn and how they pass their knowledge on. I looked at these dynamics in the lab, studying how people acquire and remember made-up “languages” with just a few words.
Of course, researching learning and communication also meant using those very skills — figuring out how to take the messy results of an experiment and present their essence to other people through writing, statistics, and visualizations. I think that studying how people share knowledge has made me better at doing it myself.
In a word: writing. In three words: writing and editing. In 26 words: writing in different formats to spread the word about Datawrapper and showcase all the cool things it can do, while helping others to do the same.
Where will you see me? Right here! I’ll be on the blog regularly with Weekly Charts, feature announcements, and customer stories. You might also find me in your inbox with a newsletter, or just about anywhere there are words on Datawrapper’s website.
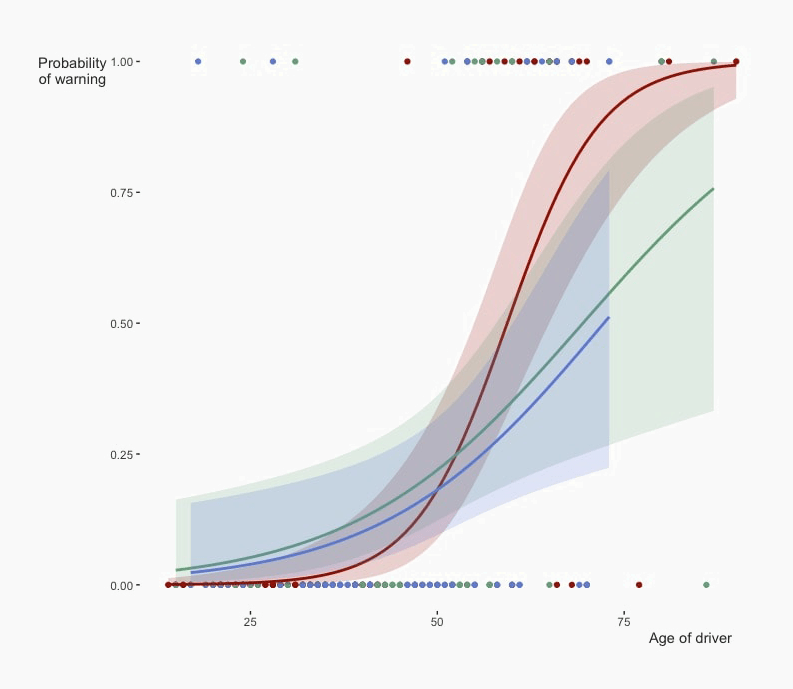
In school, “data visualization” was something of a guilty pleasure. Instead of solving problems for my statistics classes, I’d spend hours plotting the answers, tinkering with colors and experimenting with different chart types. At some point, I ended up on the Datawrapper blog — I think the first thing I read was What to consider when choosing colors for data visualization.
I kept returning to that memory this winter. In the evenings, I was spending a lot of time designing knitted colorwork:
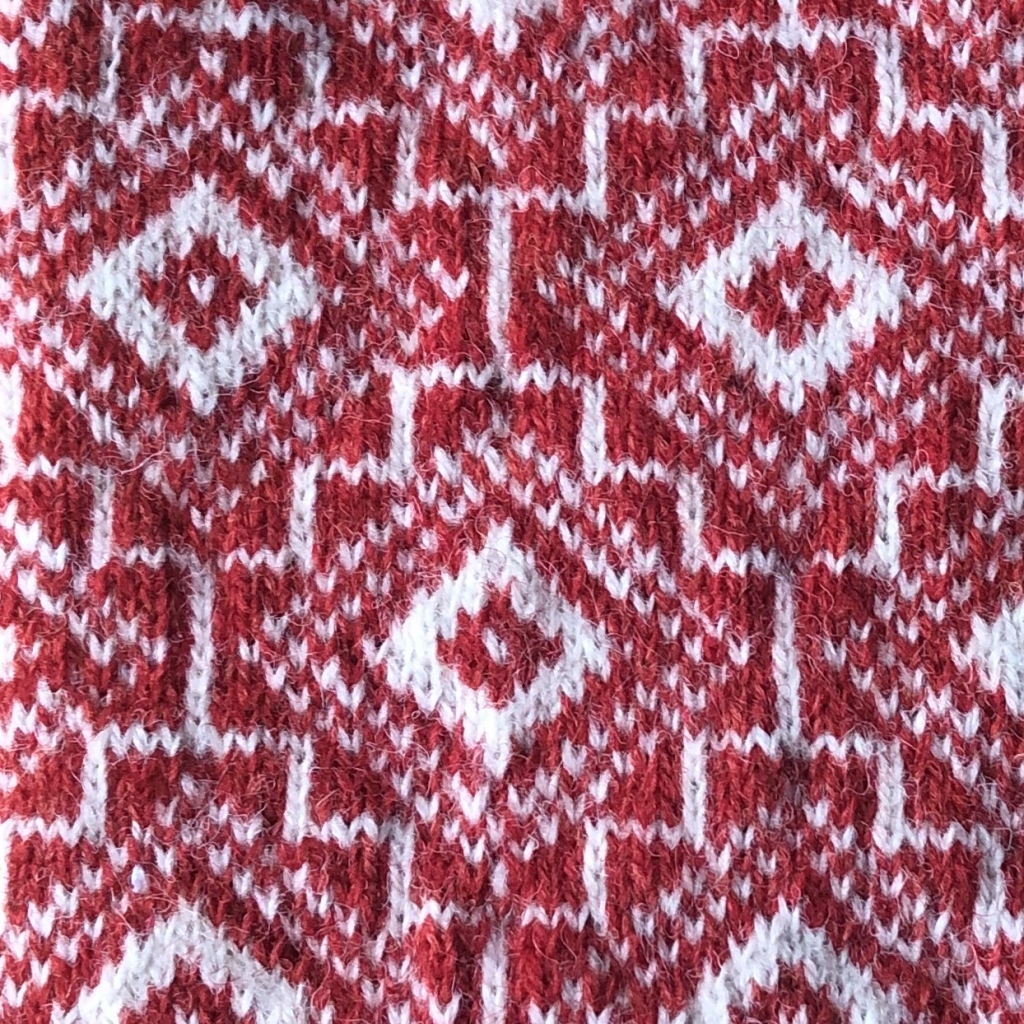
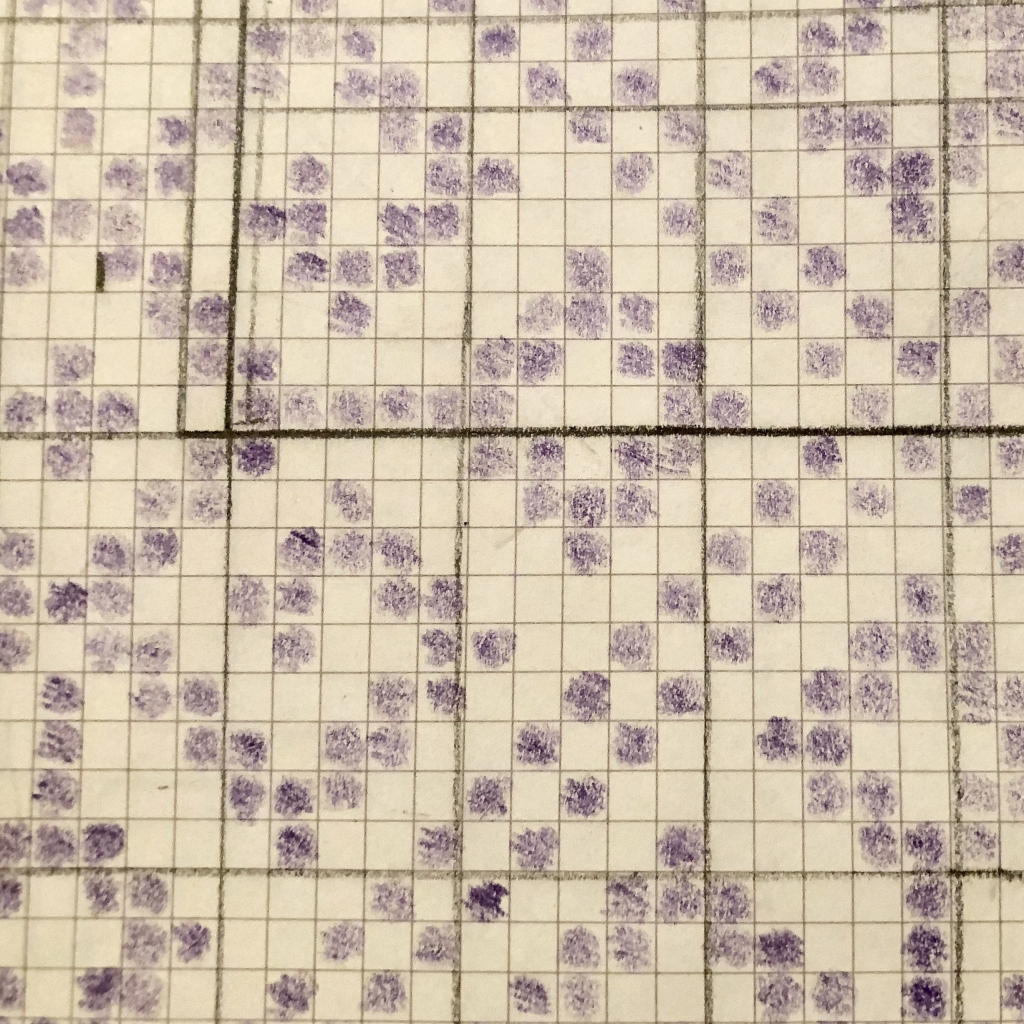
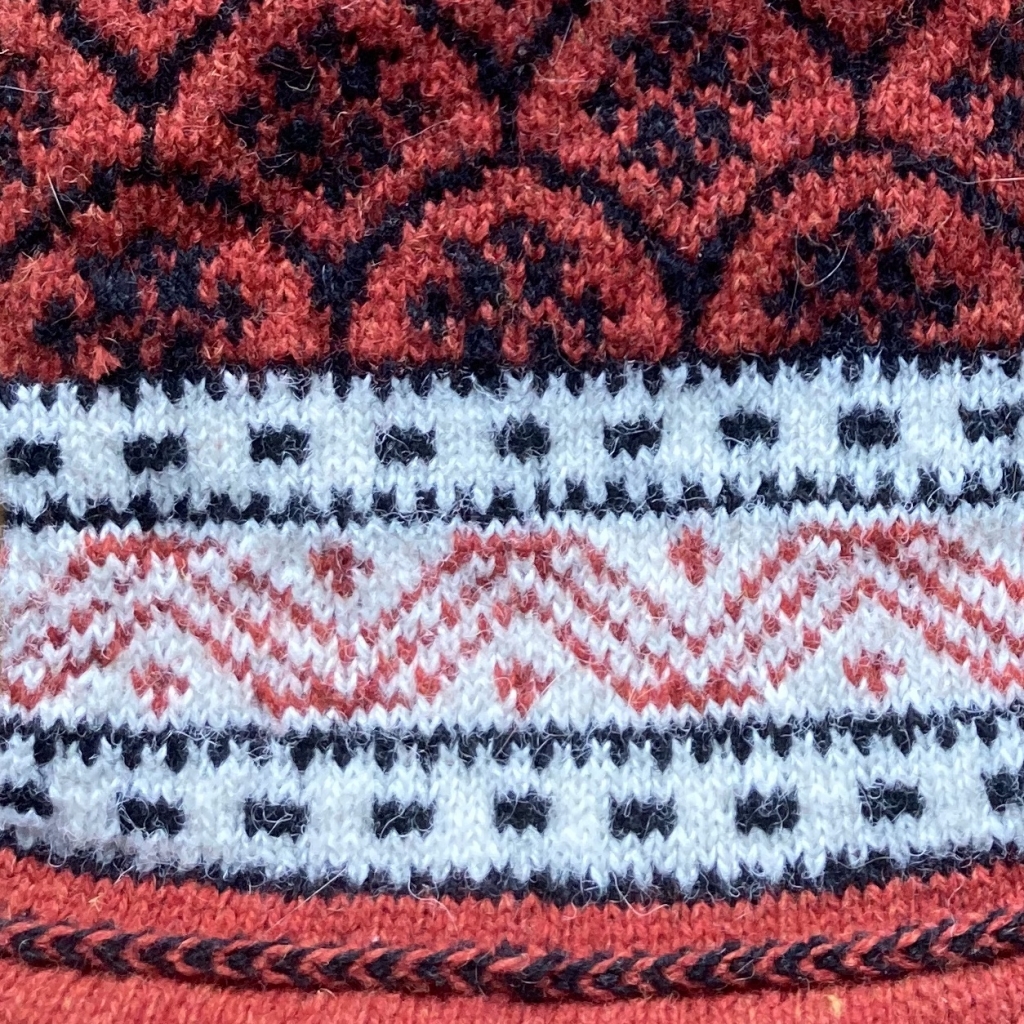
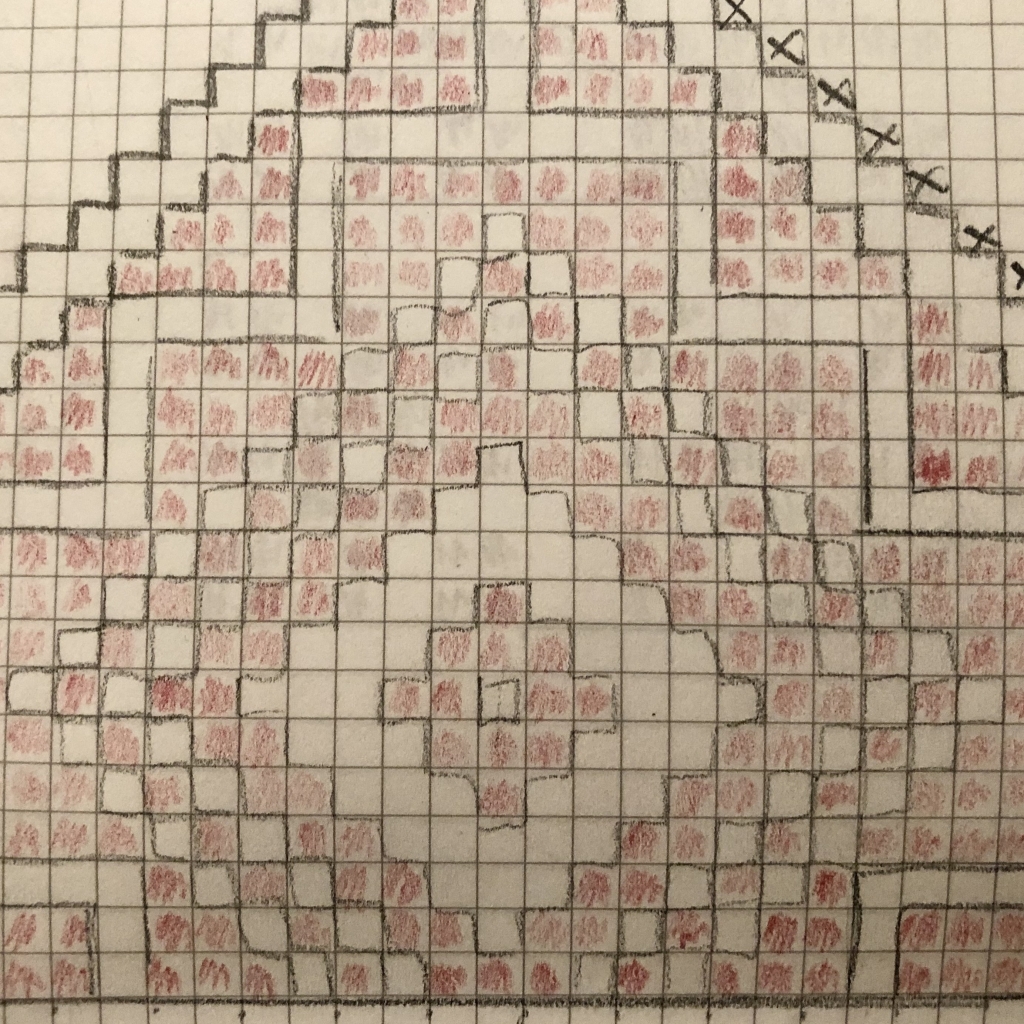
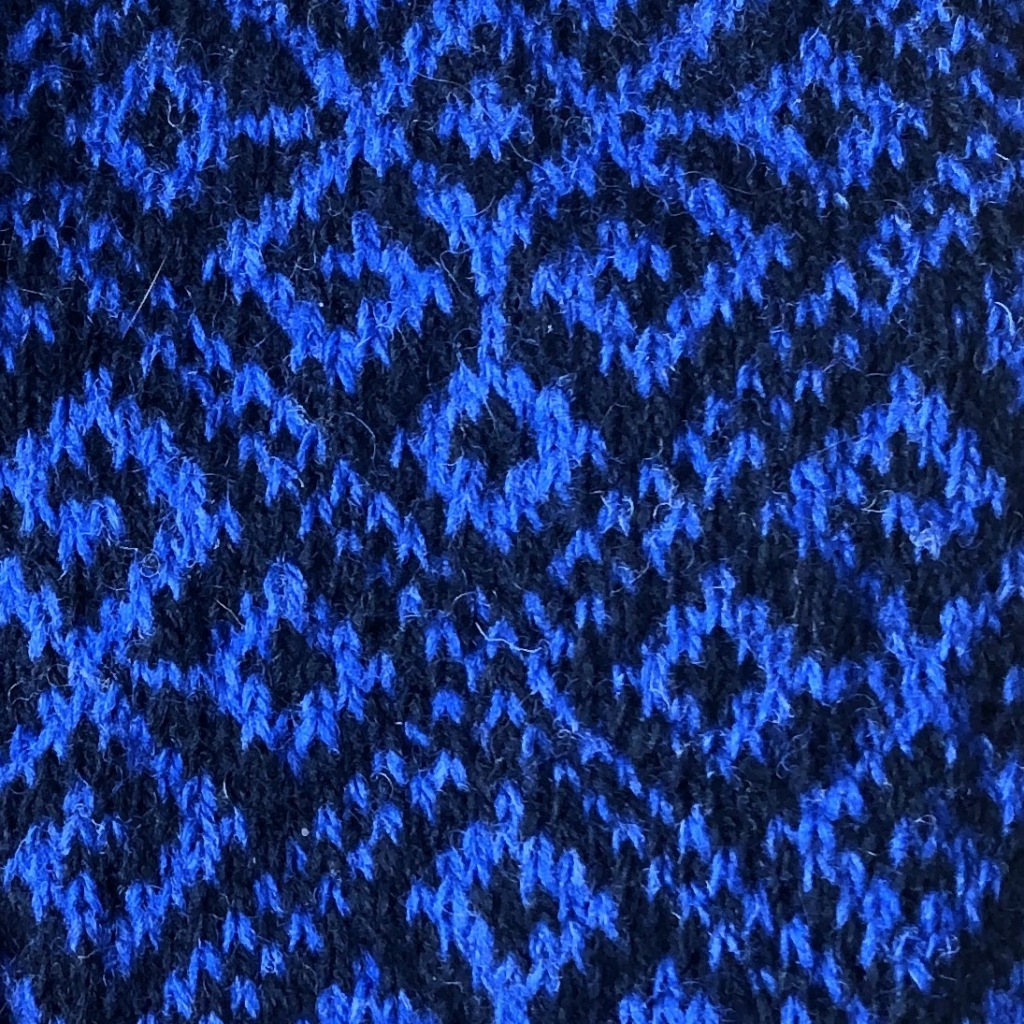
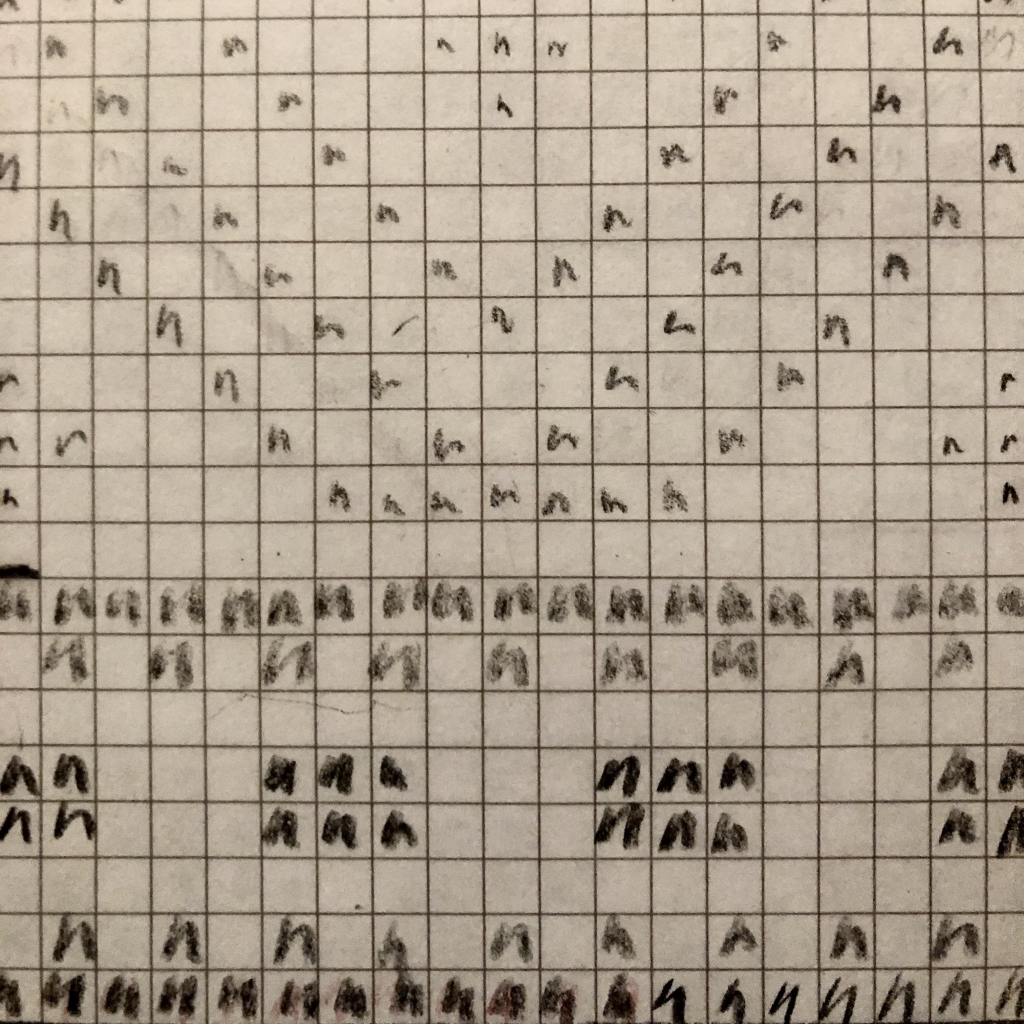
While by day, I was teaching English classes for new immigrants in New York. I loved having the opportunity to apply all that deep thinking about language and communication to such a concrete purpose, but also missed the quantitative, scientific thinking I’d always enjoyed.
During this time, I happened to pick up Edward Tufte’s classic book The Visual Display of Quantitative Information, which a friend had recommended to me years ago. My first thought: “Pictures of numbers — that’s something I’d like to do.” And then my second thought: “No wait, words about pictures of numbers — that’s something I’d really love to do!” Lucky for me, a few months later, Datawrapper was looking for someone to do just that.
I have a lot of things to learn, from technical skills to design principles, and a lot of people to meet, from colleagues to customers. (Not to mention getting started with some survival-level German.) I’m really excited to dig into it all and — see how these things come around? — to share what I know and learn with all of you. There will be cognition. There will be communication. It should be great.
I’m looking forward to meeting you! Say hi at rose@datawrapper.de.
Comments