

French people are losing confidence in the Paris Olympics
March 28th, 2024
3 min
This article is brought to you by Datawrapper, a data visualization tool for creating charts, maps, and tables. Learn more.
Hi, this is David. I’m responsible for design at Datawrapper, but this week I’ll share a chart with you. Like most of the Datawrapper team, I’m based in Berlin, Germany. It’s finally summer here now and we’re enjoying some sunny days. Besides the good weather, summer is also the best time to enjoy fresh local fruits!
In our supermarkets, we can find fruit from other parts of the world all year round. But imported fruits have some disadvantages; for example, they are less fresh and tasty by the time they reach us. And transporting goods long distances in trucks, ships, or airplanes is bad for our environment. So, these days, more people are trying to buy fresh and local fruits. That means we have to know when they are in season in our own climate.
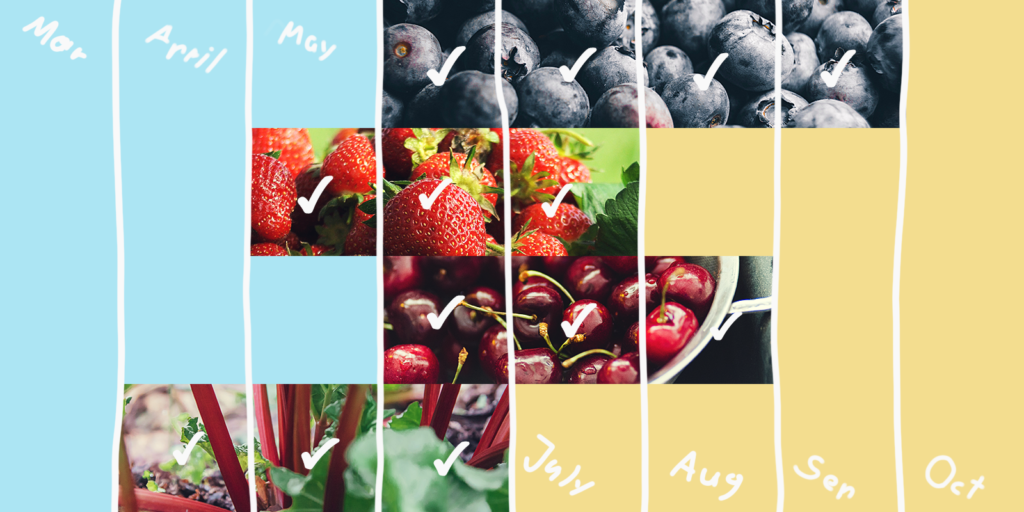
Here is a table of local fruits in Germany and when they are available fresh or from storage:
As you can see, most of them are available in the summer months and some in spring and autumn. But in winter, stored apples are the only fruit that didn’t take a long journey to reach us. So if you want to enjoy fresh local fruits, now is the best time!
The visualization above is a simple table made with Datawrapper. When you think about tables, you might think of endless rows of numbers, complicated formulas, and topics like accounting. But tables can be so much more! You can think of tables as the basic layout of your visualization and enrich them with symbols, images, colors, and mini-charts like small bar charts or sparklines.
If you often create visualizations, you might not think about tables because you want to do something more visually interesting or fancy. But fancy charts can also be harder to understand. Tables are a really good way to show information because they are so simple and everyone is already used to reading them.
You rarely see tables in articles online. And when you do, they are often embedded as an image — which has a lot of drawbacks. Embedding tables as images increases loading times on your website, and search engines and screen readers can't "read" the images, which hurts your search engine ranking (SEO) and accessibility. The reason some websites use images anyway is probably that most content management systems don’t offer a good, simple feature to create tables. But Datawrapper's easy embedding can help you with that.
Enjoy your summer, eat lots of fresh local fruits, and maybe enrich your next article with a nice table. Come back next week for a Weekly Chart from our developer Ivan.


Comments