


New: Automatically label data points in line charts
September 18th, 2024
3 min
This article is brought to you by Datawrapper, a data visualization tool for creating charts, maps, and tables. Learn more.
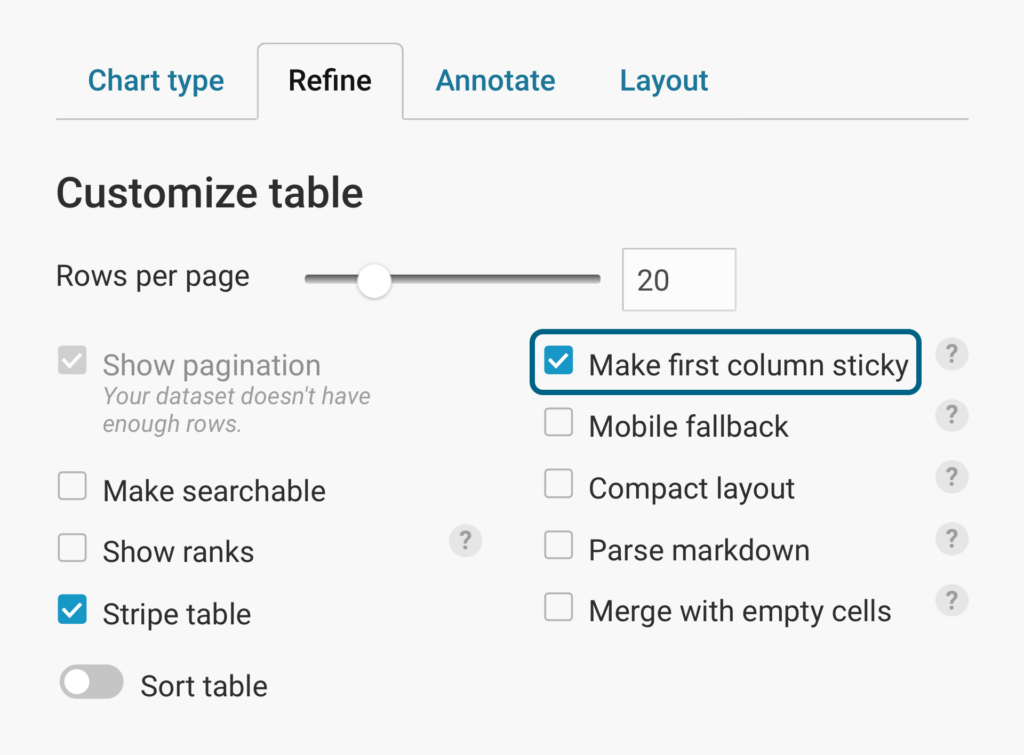
When your table has lots of columns, horizontal scrolling helps everything fit neatly on the page. Now, you can choose to make the first column “stick” to the left-hand side, so readers never lose sight of it as they scroll.
Giving your table a sticky first column lets readers explore more data without sacrificing context or clarity.
You can find the option to make your table’s first column sticky in the Refine tab of Step 3: Visualize. Try it out for yourself in the editor.
But that’s not all that’s new in Datawrapper — over the past few months, we’ve added many small features to improve your charting process. Let’s see what they are and where you can find them.
Your whole charting experience got a lot faster! We turned our app into a single-page application, so there’s no wait for the page to reload when moving between steps in the editor (e.g., from “Check & Describe” to “Visualize”).
This was the summer of Datawrapper’s 3,000th basemap — and we’re still adding more! With new cartograms for the U.S., Canada, and Russia, as well conventional maps for everywhere from Kazakhstan to Ghana to Spain, you’re all but sure to find the right foundation for your choropleth and symbol maps.
If you do need a map that isn’t here yet, our cartographer Anna will happily add it for you — just write to her at support@datawrapper.de.
Datawrapper’s flexible, responsive text annotations help your visualizations speak more clearly — and now all column charts can benefit. You can now create text annotations in regular, grouped, and stacked column charts that use categories (like these country groups) on their x-axes.
Stacked bar charts pack a lot of information into a small space. To help readers see the big picture at a glance, you now have the option to show total values for each bar. You can customize the position and number format of total value labels as well.
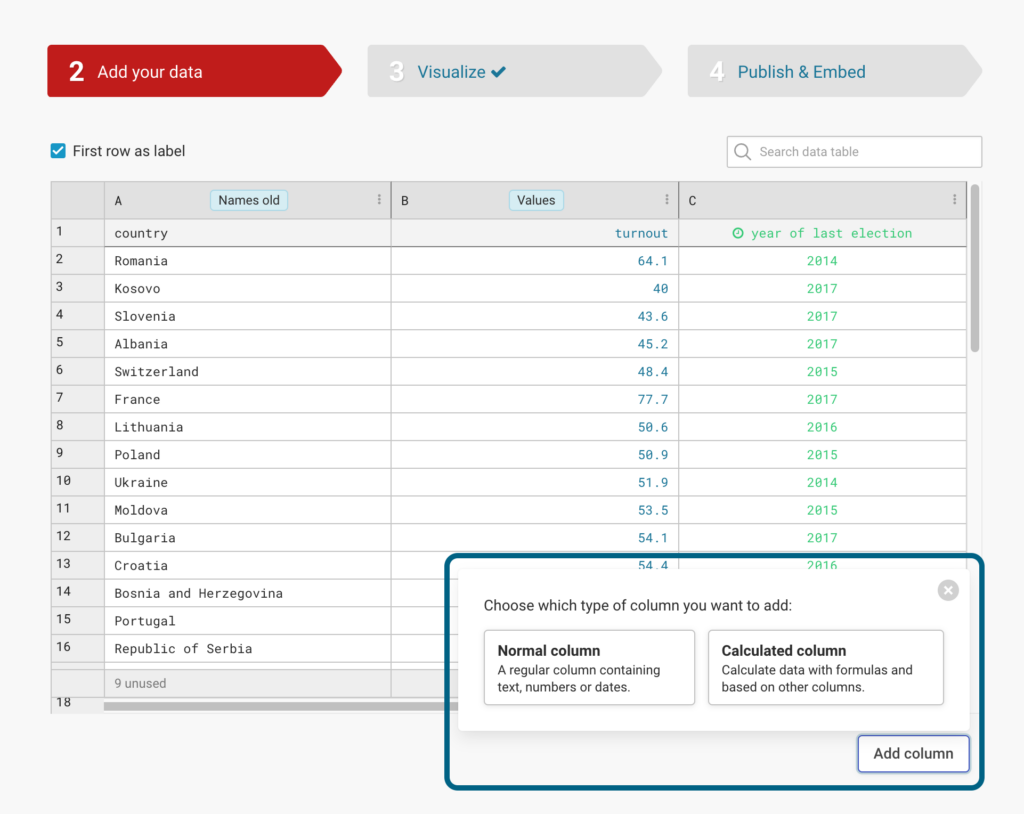
The data is in, your map is almost ready, and you realize that something’s missing? Don’t worry! There’s no need to start all over again. You can now add normal, non-calculated columns in Step 2: Add your data. This makes it easier to customize your maps — for example, by adding extra information and notes in the tooltips.
Save time by doing more with one click: multi-column selection in Step 2: Check & Describe is back! You can now hide, show, and move multiple columns at once when preparing your data.
Our themes now offer even more flexibility. If your team is on a Custom or Enterprise plan, you can now add custom icons to your themes’ locator maps, in addition to our 130 universal icon options.
These were just some of the recent improvements we’ve made to Datawrapper. You can find all the latest news and stay updated by visiting our changelog. Have a question, feedback, or feature request? Get in touch in the comments, on Twitter (@Datawrapper), or at support@datawrapper.de. We’re looking forward to hearing from you.


Comments