
New in symbol and choropleth maps: cropped view and inset maps
April 12th, 2024
3 min
This article is brought to you by Datawrapper, a data visualization tool for creating charts, maps, and tables. Learn more.
Edit January 2023: You can now add size legends to your symbol maps as well!
We have exciting news: You can now add a symbol size legend to our most versatile chart type, the scatterplot. With a legend, readers can easily see what variably sized symbols represent in your chart — both on screens and in print.
Legends are particularly useful for static contexts like print, PDF documents, and social media, where values can’t be communicated with interactive tooltips. With a size legend, your charts are ready for anything!
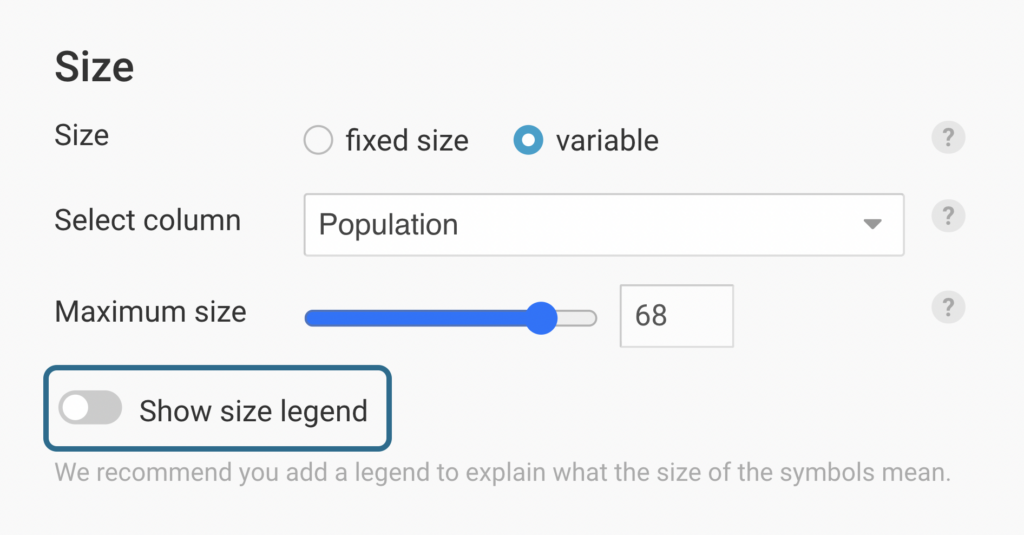
To add a size legend, go to Step 3: Visualize in our chart editor, then navigate to the Size section of the Refine tab. Once you choose variable symbol size and select a column, you can add the size legend by clicking on the new Show size legend toggle:
In the size legend menu, you can choose from three legend layouts — stacked with labels below, stacked with labels on the right, and nested. (By default, the size legend is set as stacked with labels to the right.)
You can also customize the value and format of the numbers in your legend. Select Custom in the size legend menu to type in your preferred values and choose from 18 preset number formats, plus a fully custom option.

Every scatterplot is different, so when it comes to the position of the size legend there isn’t one correct choice. That is why we give you a strong default option and the freedom to change it.
When you go to the Legend position, you can choose to place it above the chart, below the chart, or inside it, in one of six preset options. If you choose to position the legend inside the chart, you can then adjust it further and offset the position vertically or horizontally. The legend is positioned above the chart by default.
Finally, teams on a Custom or Enterprise plan have even more choices when it comes to changing the looks of the size legend. On top of the many options above, you can adjust the fonts, colors, and spacing of the legend design as well. Get in touch with our support team and we’ll be happy to help make those changes!
We look forward to seeing your scatterplots sporting size legends soon — digitally and in print! To explore this new feature hands-on, head over to our chart editor. If you have any questions or comments, you can reach us at support@datawrapper.de.


Comments