

New: Automatically label data points in line charts
September 18th, 2024
3 min
This article is brought to you by Datawrapper, a data visualization tool for creating charts, maps, and tables. Learn more.
Datawrapper visualizations are great for embedding on the web. Just copy the embed code, insert it in your page and your beautiful chart, map or table will be there for readers.
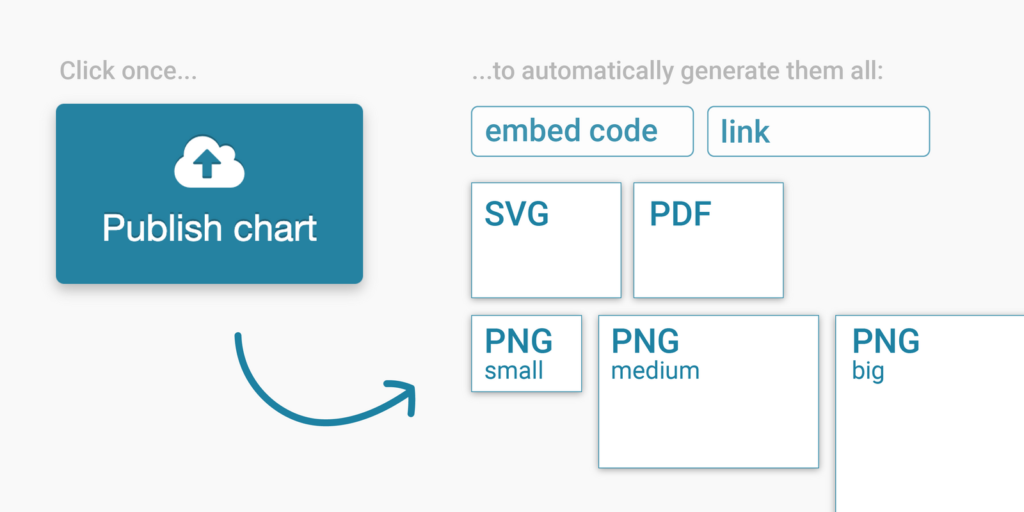
But maybe you’re using software where you can’t just embed an iframe. Or you need a preview image for your social media post. With our new “Image Publishing” feature for users on a Custom or Enterprise plan, you can configure Datawrapper to automatically generate images of your visualizations whenever you hit publish.
To set up Image Publishing, go to your account settings in Datawrapper and select your team to get to your team settings. Now click on “Images”. Here you can configure which files will be created automatically whenever your team publishes a visualization.
Datawrapper will always create three default PNG images. But the real power comes from defining your own custom formats, which you can do by clicking on “Add static fallback format”. Add a filename, choose a size and a filetype (PNG, SVG or PDF).
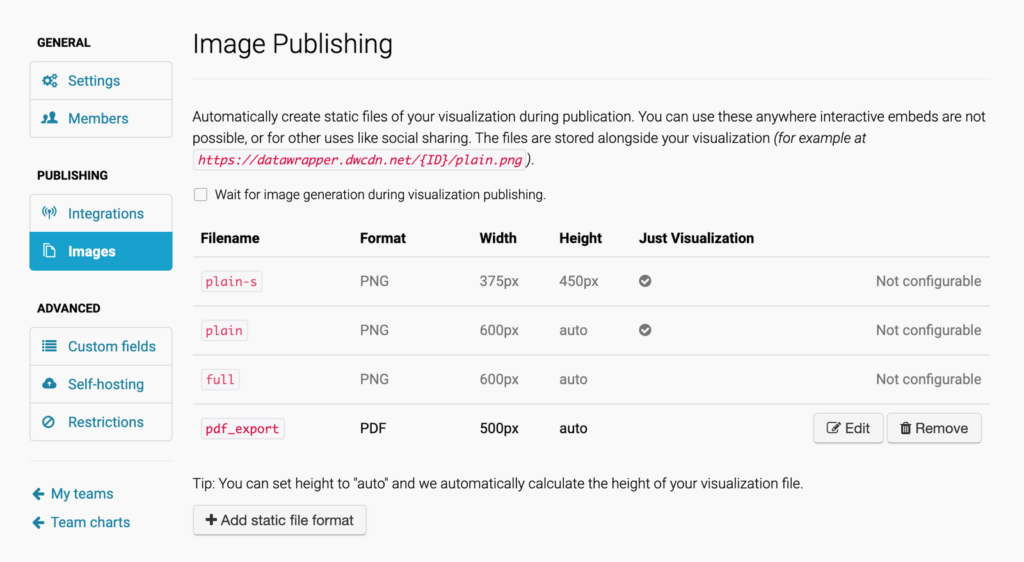
If your image shouldn’t include the footer and header of your visualization, select “Just Visualization”. Then click save – and that’s it! Publishing a chart, map or table will now create the additional images you defined.
You can find the generated images in the same place as your visualization. Its URL looks like this one:
https://datawrapper.dwcdn.net/M5I3Y/8/
Remove the version number (8) from the URL, add your filename with extension and you should see the created image in your browser:
Example Image URLs of chart “M5I3Y”
https://datawrapper.dwcdn.net/M5I3Y/plain.png
https://datawrapper.dwcdn.net/M5I3Y/full.png
https://datawrapper.dwcdn.net/M5I3Y/pdf_export.pdf
…
You can download the images with your browser or directly link to them.
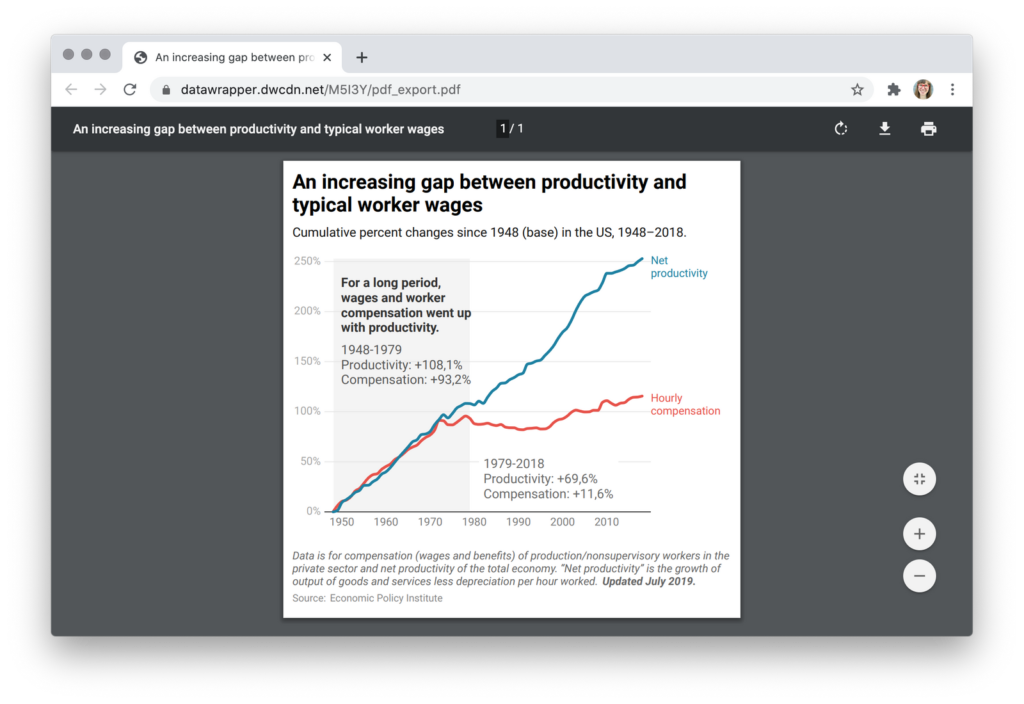
PDF of the chart with the ID M5I3Y, automatically generated by Datawrapper when the chart is published.
There are a lot of ways how to use this new feature. All of them will reduce the need to manually export your chart, map or table. Here is a list of some use cases:
Email newsletters and RSS feeds don’t support embedding of iframe elements, but if your article references a visualization it would be odd to not include it. With Image Publishing, you can generate a fallback image for these cases:
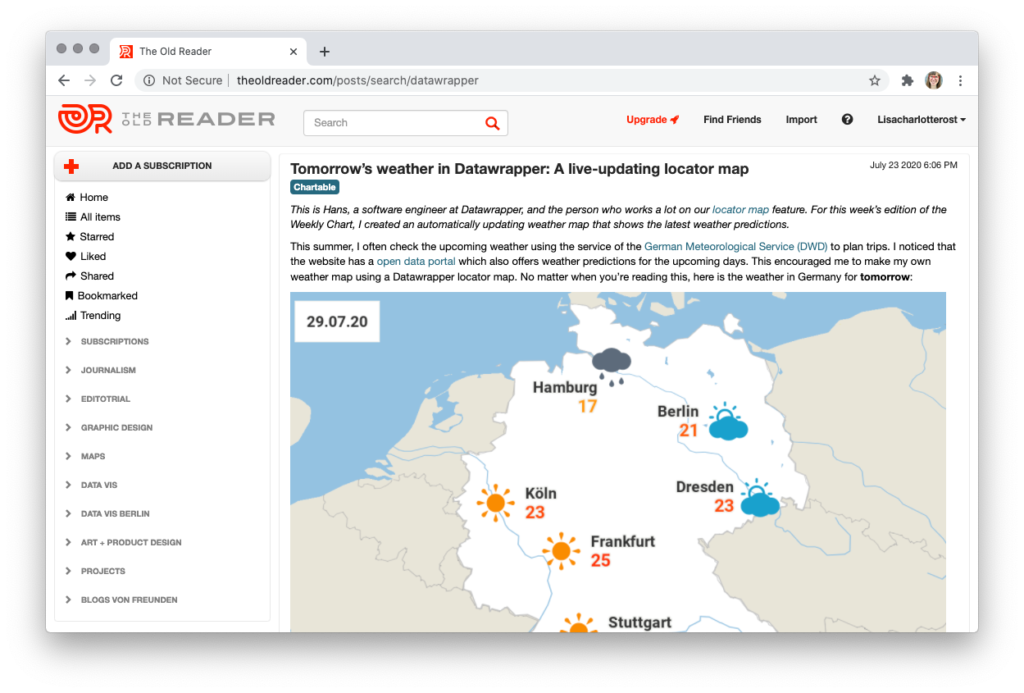
Fallback image in an RSS reader, showing one of our blog posts.
Let’s say you wrote an amazing article with a Datawrapper visualization embedded and want to promote it on your Twitter or Facebook profile. A post with an image is usually better for engagement, and now you can use Image Publishing to generate automatic preview images for your links.
You can set up an integration with Datawrapper’s API to display a list of your team’s Datawrapper visualizations directly in your content management system (CMS), similar to what you can see in “Team Charts” on Datawrapper. This can make it super simple for editors to write an article and find the correct visualization without ever leaving your CMS.
By default, the images are created after your chart, map or table is published. That means you can embed the chart already, but the images might not be ready yet. If you need the images at the same time as the embed code, click on the checkbox that says “Wait for image generation during visualization publishing”.

This increases the time to publish a visualization – but you can be sure that when your embed code is ready, your images will be ready, too.
Not all visualizations will fit into a fixed height. A bar chart with four bars might fit into a 2:1 social media image; a bar chart with 20 bars won’t. Set the height setting to auto and Datawrapper will generate an image with the correct height for your chart.
img.datawrapper.de in the past. Do I need to switch?Yes, we recommend you to switch to datawrapper.dwcdn.net. We transferred all your published visualization files from img.datawrapper.de to datawrapper.dwcdn.net already. This way, you don’t need to remember two locations – your charts and images are now in one place. img.datawrapper.de will still work for some time, but if you can, simply use the new URLs.
If you take a closer look at the team settings, you’ll see we added quite some new features in the last weeks & months. Here’s what you might have missed:
%chart_url%, %chart_width% and %chart_height%. Works on any plan, including the free one.We hope these feature wiill be of big help for your visualization production workflow. Do you have feedback, questions, or hints? Write to us at support@datawrapper.de. We’re always happy to hear from you.


Comments