This article is brought to you by Datawrapper, a data visualization tool for creating charts, maps, and tables. Learn more.
The older you get, the higher your life expectancy

Hi, this is Lisa! At Datawrapper, I’m responsible for the blog. Today, I’m here to tell you of a curious discovery I made the other day.
If you read Hans Rosling, or know the website Our World in Data, or follow his creator Max Roser on Twitter, or read anything else about positive global developments (all things I recommend to do), you know that people have a way higher life expectancy nowadays than 20 or 50 or 100 years ago.
That development hasn’t stopped yet. Your parents have a lower life expectancy than you. You have a lower life expectancy than your children. Girls that are born in 2017 in Germany will become, on average, 92.90 years old. As somebody born in 1990, my life expectancy at birth was barely 90 (89.44, to be exact)[1].
But here’s what I only started to understand last week (and I was kind of mind-blown by that, so I’m thrilled to share it with you): Our life expectancy increases with every minute we live. When I turned 30, my life expectancy got up to 90.37 years. Once I turn 80, it’ll be 93.76 years.
But if I really make it up to 93.76 years, it doesn’t mean I’ll necessarily die any day. My life expectancy with 93 increases to 98.31 years. My life expectancy with 98 increases to 101.44 years.
Why is that?
It’s simple! And fascinating. (I think.) Your life expectancy increases because it doesn’t get dragged down by people who died before you.
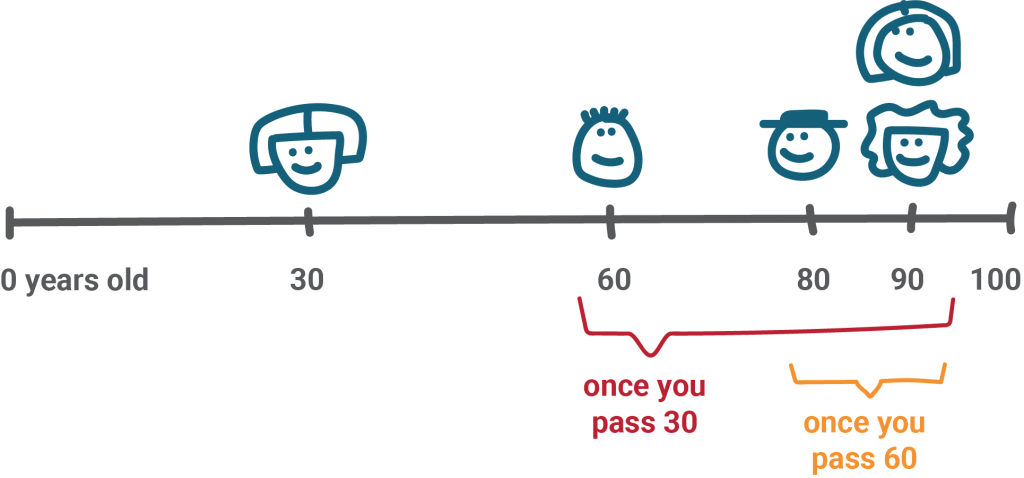
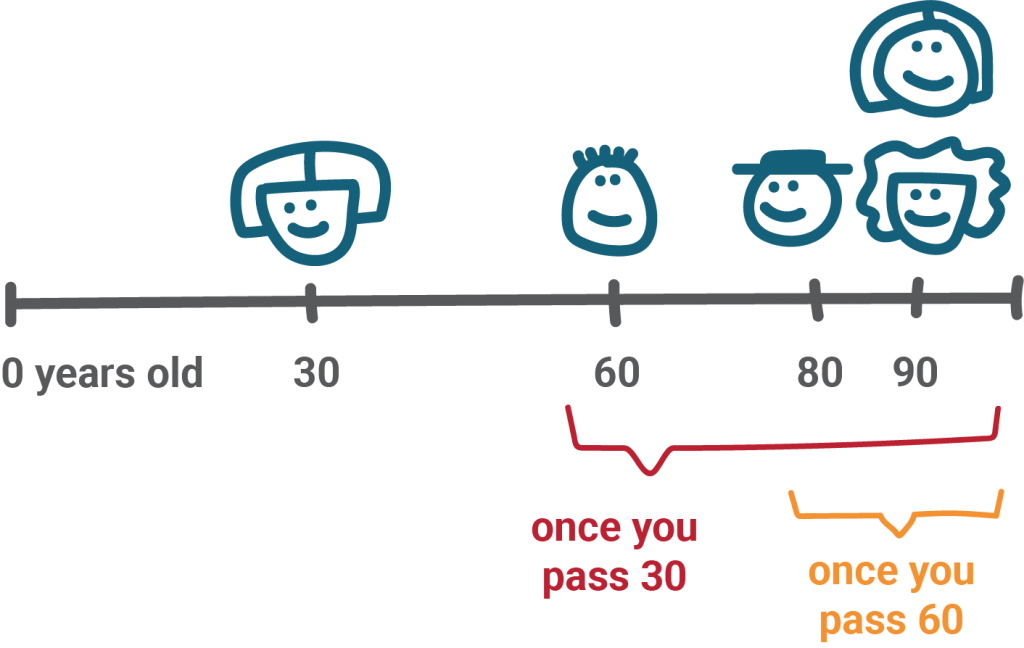
Here’s an example. Imagine you get born into a little town of five people. You already know when these people will die (sorry for that cruel scenario):
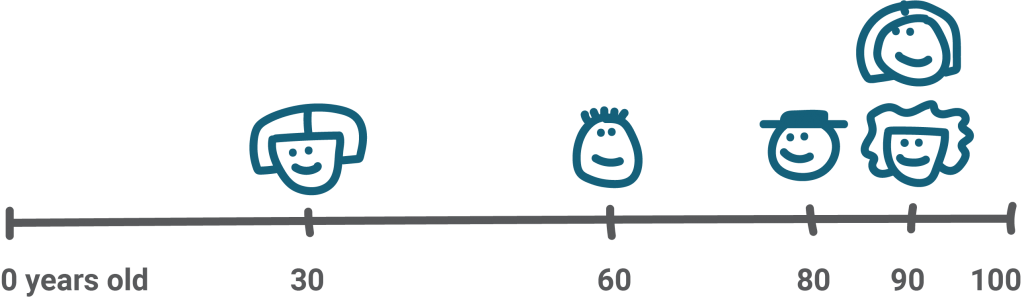
At birth, your life expectancy is (30+60+80+90+90)/5 = 70 years. (In the real world, nobody would seriously estimate a life expectancy with such a small population.) But once you pass 30 – the age when your neighbor dies – your life expectancy goes way up. Suddenly it’s (60+80+90+90)/4 = 80 years. And once you’re past 60, it increases once again to (80+90+90)/3 = 87 years.
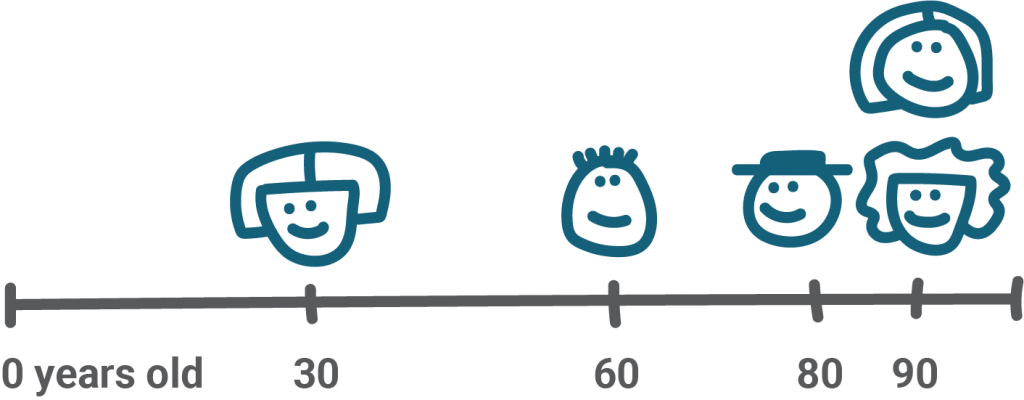
Only the ages older than you are taking into account in your life expectancy:
In a nation with millions of people, you’re basically always at the very bottom of all the people who are taken into account to estimate the life expectancy. That estimate goes up with every second you live (and others die).
It’s the same for men, but they’re 20 years late
The chart above shows the life expectancy for females born in 1990. Let’s zoom out a bit – how many years remain for 80-year-old men? A widely known fact is that men have a shorter life expectancy than women. Turns out, this is also the case for high ages. Let’s look at Germany again:
There are at least three things we can read from this chart:
- Women have more estimated remaining years than men – but this difference is going down since the 1950s.
- The “remaining years to live” for 80-year olds have continued to rise for almost 100 years now, for both men and women.
- Men catch up with a 20-year delay: The life expectancy of 80-year-old men born in 1990 will be the same as the life expectancy of 80-year-old women born in 1970.
Let’s remind ourselves that these are all estimates calculated by the Federal Statistical Office of Germany. I’d love to time-travel 100 years into the future and back to show you the real numbers for people born in, e.g., 1970, 1990, or 2010.
Comments? Feedback? Did I get it all wrong? Let me know down there in the comments or write me: lisa@datawrapper.de. We’ll see you next week!
References
Life expectancy is a fascinating topic – and, because it has steadily gone up, also a joyful one. Start here:
- A Twitter thread by Ilya Kashnitsky about what life expectancy measures, actually. (“Life expectancy is a snapshot of the *current* mortality.”)
- If you’re German, download these massive cohort mortality tables as PDF or Excel file to check the estimated life expectancy for your age and your birth year.
- To see how the life expectancy increased for each age group for English and Welsh people, head over to Max Roser’s It’s not just about child mortality, life expectancy improved at all ages.
- For a great, chart-heavy explanation of the low US life expectancy, read Max Roser’s Why is life expectancy in the US lower than in other rich countries?
- This increase has been still driven a lot by fewer new-borns that die. The likelihood to become 11 years old when you’re 10 years old is almost 100% for girls born in either 1990 or 2017. But the likelihood that they live to 1 when they’re just born increased from 99.39% in 1990 to 99.73% in 2017. ↩︎


Comments