This article is brought to you by Datawrapper, a data visualization tool for creating charts, maps, and tables. Learn more.
New: Stay organized with a more powerful, faster visualization archive

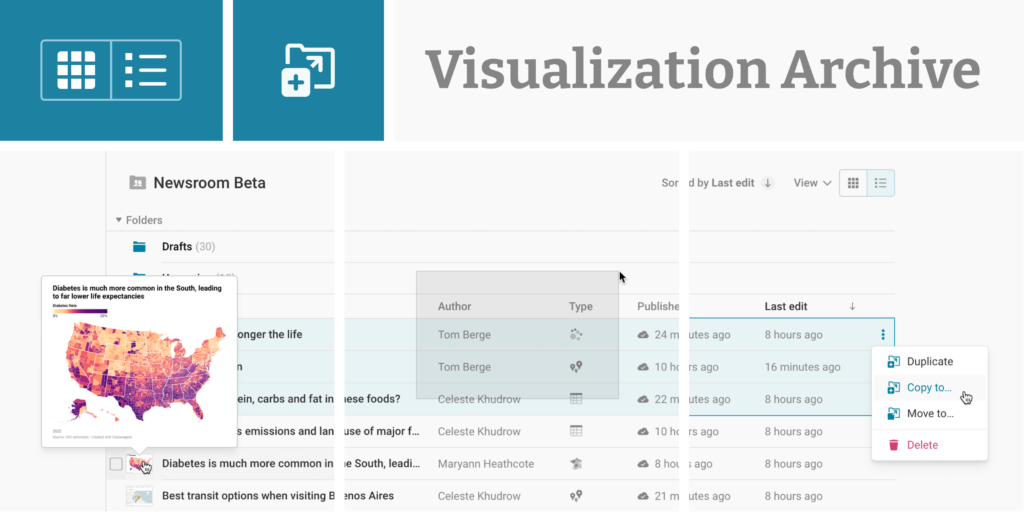
All the visualizations you and your team create have their home in Datawrapper’s visualization archive. With folders, team-wide search, and custom fields, the archive is designed to make managing your visualizations as efficient as possible — whether you’re working on your own or in a team of hundreds of colleagues. Today, we’re launching big improvements to make working with the visualization archive more intuitive, more practical, and faster than ever:
See more at a glance with list view
When your team creates lots of visualizations, folders can fill up quickly. The archive’s new list view shows all that work at a glance:
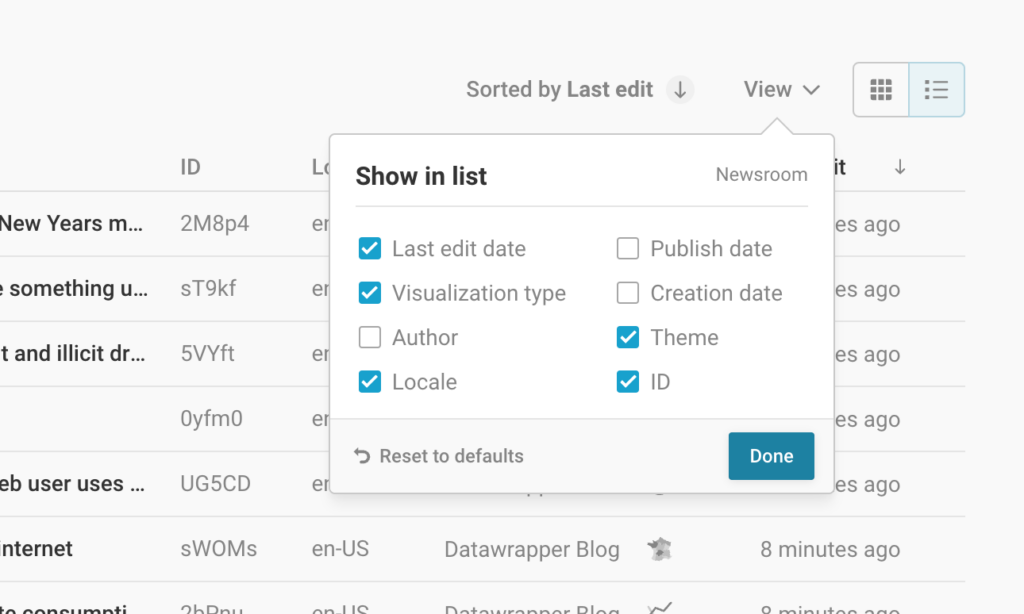
See the most important information in a compact view, or display additional metadata such as the chart language or a custom field to get a quick overview of everything that’s happening:

Bulk actions: Select, move, or copy multiple visualizations at once
Reusing visualizations is now easier than ever: Simply click and drag across your archive to select any number of visualizations in both grid and list view. Then easily copy, move, duplicate, or delete them with one click:
Move or copy entire folders at a time
Folders are essential for keeping a large archive organized. Now you can easily move or duplicate entire folders across your visualization archive, or even across different teams. Simply select any folder and choose whether to move or copy it to its new location.
Performance improvements all around
To work efficiently, speed matters more than anything. In the new archive, you’ll notice significant performance improvements across the board: faster loading times (especially for archives with many visualizations), quicker sorting options, and speedy navigation between folders.
Thanks to everyone who worked on his feature: Alexander Käßner, Antonio Sarcevic, David Wendler, Gustav Neustadt, Jack Goodall, Julian Freyberg, Linus Aarnio, Marten Sigwart, and Pascal Bürkle.
Starting today, the new archive is available for all users on all pricing plans. We hope it helps you be even more productive and efficient when working in Datawrapper. Do you have feedback or suggestions to help us better support your workflows? Don’t hesitate to reach out to our team at support@datawrapper.de.


Comments