This article is brought to you by Datawrapper, a data visualization tool for creating charts, maps, and tables. Learn more.
Tomorrow’s weather in Datawrapper: A live-updating locator map

This is Hans, a software engineer at Datawrapper, and the person who works a lot on our locator map feature. For this week’s edition of the Weekly Chart, I created an automatically updating weather map that shows the latest weather predictions.
This summer, I often check the upcoming weather using the service of the German Meteorological Service (DWD) to plan trips. I noticed that the website has a open data portal which also offers weather predictions for the upcoming days. This encouraged me to make my own weather map using a Datawrapper locator map. No matter when you’re reading this, here is the weather in Germany for tomorrow:
It shows similar information as the German weather map from DWD’s website:
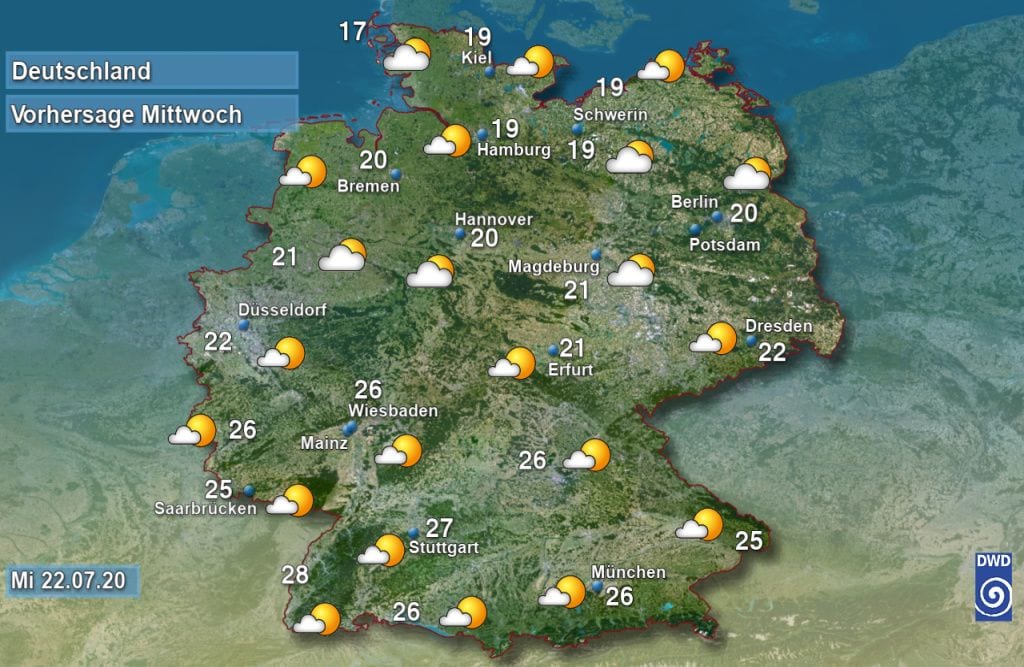
I started recreating the map (with fewer locations) in the locator map editor. Conveniently, locator maps offer a variety of weather icons out of the box. I also gave the temperature markers colors that indicate the temperature. To show the date of the map, I used a marker with a text box.
But this is not a normal locator map. Creating a weather map for a single day would be pointless – it would be outdated by the time the blog post would have been published. So I wrote a script (scraper) that extracts the most recent weather data from the DWD data portal. You can find it on GitHub and adapt it if you like. There are also many weather stations available outside of Germany.
I then parsed that data to make it work with locator maps and displayed it on the map. Here’s how:
How to use an external source for locator maps
Using an external source for a locator map is currently not officially supported, so the steps are a little complicated – but doable. To create a map that uses the most recent weather predictions, you will
a) probably have to write a script that extracts data from a website or downloads it from somewhere, and you will
b) need to write a script that parses your data in a way that it works with locator maps.
You’ll need basic programming skills to do this. Here are the steps in detail:
- Create a Datawrapper locator map. You can do so here without signing up.
- Add and style the markers and style your map.
- For the next steps you will need your chart ID, which you find in the URL. In this example app.datawrapper.de/edit/3wFkh/publish, 3wFkh is the ID.
- Now you can get the raw marker data in JSON format at this URL (remember to replace the ID): api.datawrapper.de/v3/charts/YOUR_ID/data. Here’s the JSON for the map above: api.datawrapper.de/v3/charts/3wFkh/data.
- You can now use this dataset as a template for how your data output is supposed to look like. Adjust your script accordingly. Here’s mine.
- Now upload your dataset to a place where it is publically available. e.g. to gist.github.com
- Go to app.datawrapper.de/chart/YOUR_ID/upload. Choose “Link external dataset” and “Serve data file directly” and paste the URL where your dataset is located into the text field. Click the “Proceed” button to validate your actions.
- Now go back to your map (app.datawrapper.de/edit/YOUR_ID/publish) and publish it. The map will now load the data from your specified external source.
We’re thinking of making these steps more convenient for you, so if you find it useful to use external data for your locator map, let us know – either below in the comments or at support@datawrapper.de. See you next week with a Weekly Chart from our support engineer Aya!


Comments