This article is brought to you by Datawrapper, a data visualization tool for creating charts, maps, and tables. Learn more.
What the difference between mean and median tells us about income inequality
The tale of the seven workers

This week, we’ll have a closer look at the concept of mean (= average[1]) and median. It’s a longer Weekly Chart than we normally write at Datawrapper, so get ready for the ride:
To play around with this chart or embed it in your own articles for free, hover over it and click on “Edit this chart” in its top right corner.
Maybe you don’t understand yet what that chart wants to tell you. I hope that will be different at the end of this article:
Median vs Mean
The mean in this chart answers the question: “If income would be equally distributed to all people, how much would everyone earn?”. The median answers the question: “What does the person earn who earns exactly more than 50% and less than 50% of the population?”
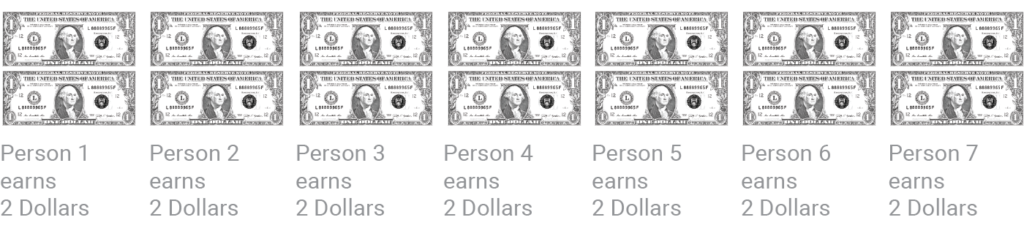
Let’s imagine a country with the beautiful name “Country A”. Seven hard workers live in Country A: Person 1 to person 7. Everyone earns exactly $2 each year (that’s ok, because, um…bread only costs $0.00001):
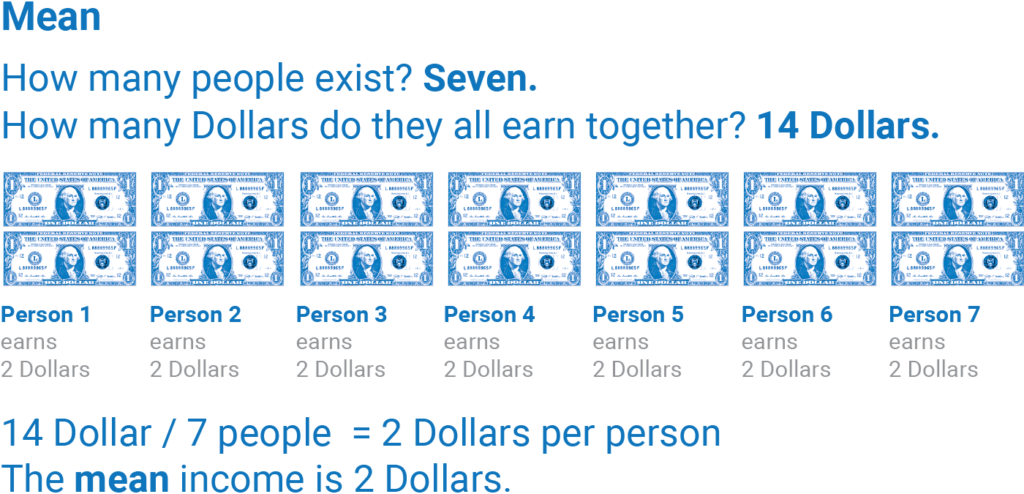
How would we calculate the average/mean income from here? Most of us learned that in school: We divide the total income in this country by the number of people:
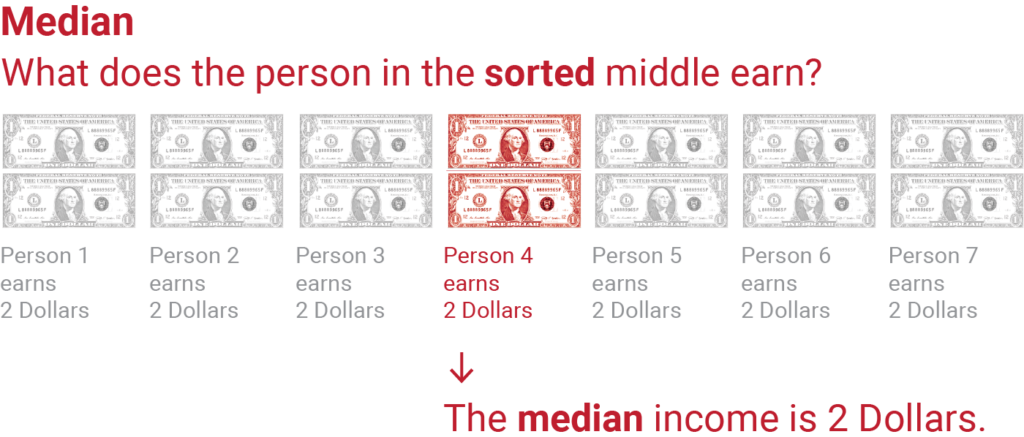
So what’s the median then? It’s even easier: First, we sort our values. (Since everyone earns the same money, that’s not necessary here.) Then, we find out what the person “in the middle” earns. And that’s it!
Unequal
After living happily ever after for some while, our little Country A becomes capitalist. Suddenly, we end up with a distribution of income far more common in the world out there. The good thing is: The seven people make more money in total ($21 instead of $14). The bad thing: Three of these people earn less than before. The income is distributed unequally:
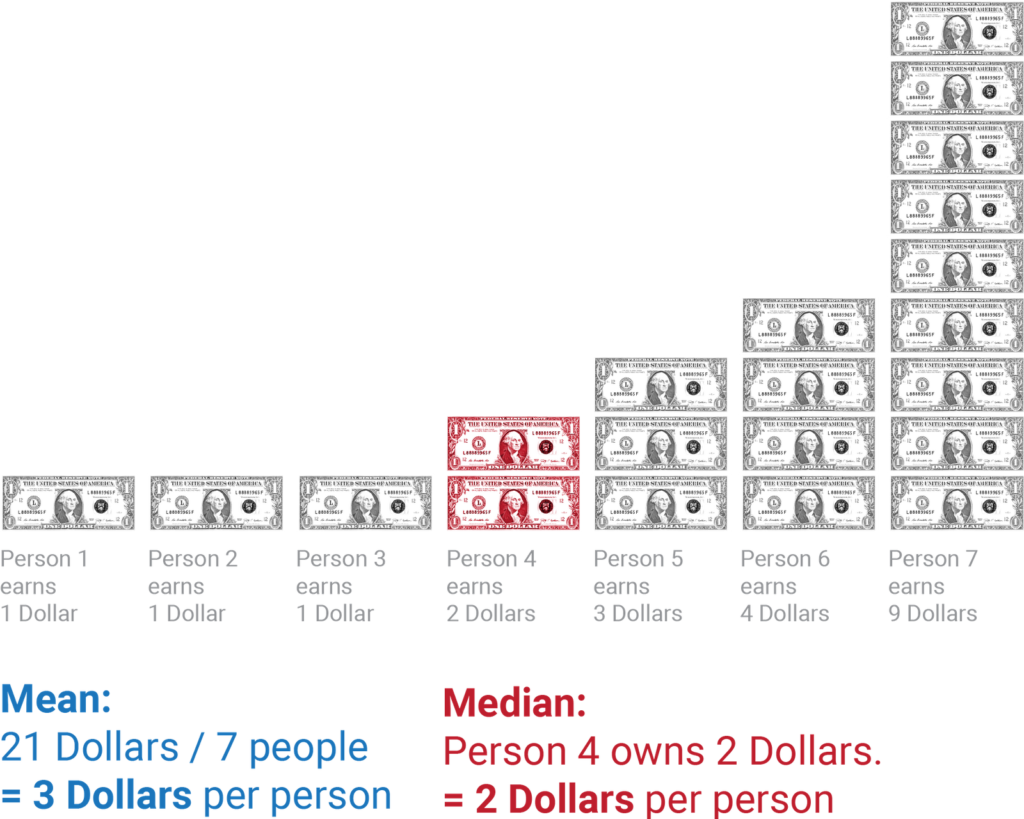
The mean tells us that everyone could make $3. But the median tells us that the poor half of our little country makes $2$$ or less.
The mean is higher than our median because the increased total income has an effect on the upper 1% but not on the worker “in the middle”. The median doesn’t care about the income of the 1%, but the mean does. In general, means take outliers into account, medians don’t.
In all countries in the chart on the top of this article, we see the same phenomenon: the mean is higher than the median. The average income tells us how much money everyone could make in a perfectly equal society. But the “man in the middle” makes only half (in the US) or two third (in Norway) of that money– and 50% of the population earn even less.
Unequal and unequal…er
Back in the sunny days, the mean and the median income in our little country were the same. But that doesn’t always mean that everyone earns exactly the same. The income might be distributed like in the country on the right. Let’s call it romantically “Country B”:

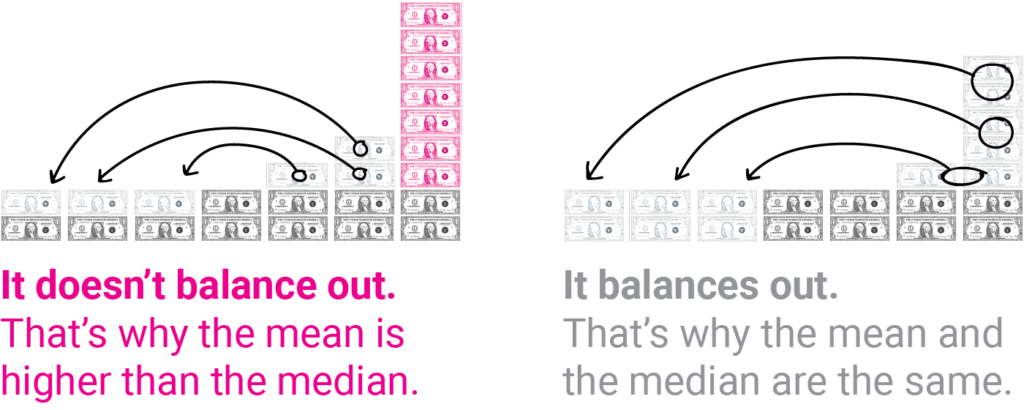
Both societies (our Country A and the new Country B) seem pretty unequal. How come the mean and the median are the same on the right but not on the left?
That’s because in Country B on the right, the income balances out: The three people on the left of the “man in the middle” are poorer to the same amount that the two richest people are richer.
Let’s take a closer look at that and assume you’re Robin Hood: You take the money from the rich and give it to the poor. In Country B, everyone would earn exactly as much as the man in the middle after your great re-distribution. In Country A, the rich earn so much money that even the man in the middle would earn more if all the income were distributed equally. The median would increase.
All the countries in the chart at the beginning of this article are similarly unequal as our Country A. In all these countries, from Luxembourg and the United States to Poland, you could “fill” the income of the poor half of the population up to the median income with the money of the rich. But then the extra income of the rich half of the population wouldn’t be empty yet. So you could take the remaining money and go around and give out a second round.
This is one way to read the chart at the top (and the fact that the mean income is higher than the median income): That in all these countries, way more than half of the population would earn more if all the income would be distributed equally.
That was a pretty long episode of the Weekly Chart. But don’t worry, we won’t make that a habit. We’ll have our regular shorter article next week. See you then!
- Mean and average are both the same thing. It doesn’t matter if you say “The mean income is $20k” or “On average, everyone earns $20k”. Same, same. ↩︎


Comments