Radish to romanesco: A year in vegetables
February 20th, 2025
4 min
Datawrapper lets you show your data as beautiful charts, maps or tables with a few clicks. Find out more about all the available visualization types.
Our mission is to help everyone communicate with data - from newsrooms to global enterprises, non-profits or public service.
We want to enable everyone to create beautiful charts, maps, and tables. New to data visualization? Or do you have specific questions about us? You'll find all the answers here.
Data vis best practices, news, and examples
250+ articles that explain how to use Datawrapper
Answers to common questions
An exchange place for Datawrapper visualizations
Attend and watch how to use Datawrapper best
Learn about available positions on our team
Our latest small and big improvements
Build your integration with Datawrapper's API
Get in touch with us – we're happy to help
This article is brought to you by Datawrapper, a data visualization tool for creating charts, maps, and tables. Learn more.
Two weeks ago, we used Google Books Ngram data to explore how often English book authors used terms like “thirties”, “forties”, etc. But the Ngram viewer doesn’t just offer a giant English book corpus. It also lets us search through books in German, Spanish, Hebrew, Russian, etc. So let’s compare how words are used in different languages!
Wait a second. That’s the whole point of different languages, isn’t it: That words are different. Hardly comparable. Even place names (New York, Nueva York, Нью-Йорк) or people’s names (Jesus, Jésus, ישו) are not the same. So what can we compare?
I thought about it. And I came up with an answer: Numbers! Numbers are written the same in all the languages that the Ngram viewer offers us to explore. Which means we can create a chart like this:
It’s hard to draw lots of conclusions from of this chart: Maybe Hebrew books refer to the end of the second World War differently compared to German books. Maybe Russian books contain “the end of the second World War” while German books contain “1945” – since most Germans know what that number entails.
But if we want to, we can read out of this chart that Germans didn’t stop referring to the World War for a long time; that only recently we’ve seen “1945” mentioned in books less than in the last sixty years[1]. It visualizes what Germans call “Erinnerungskultur” or “Culture of Remembrance”: not ignoring the past (even when it’s hard), but building monuments and museums, teaching it in schools, making movies about it. And writing about it in books.
To get the Ngrams viewer numbers, I used a Python script by Matt Nicklay called google-ngrams. We tell the script “please download all Ngram numbers for the term 1945 in the French book corpus between 1930 and 2008” and it gives us a csv with our numbers. Sweet.
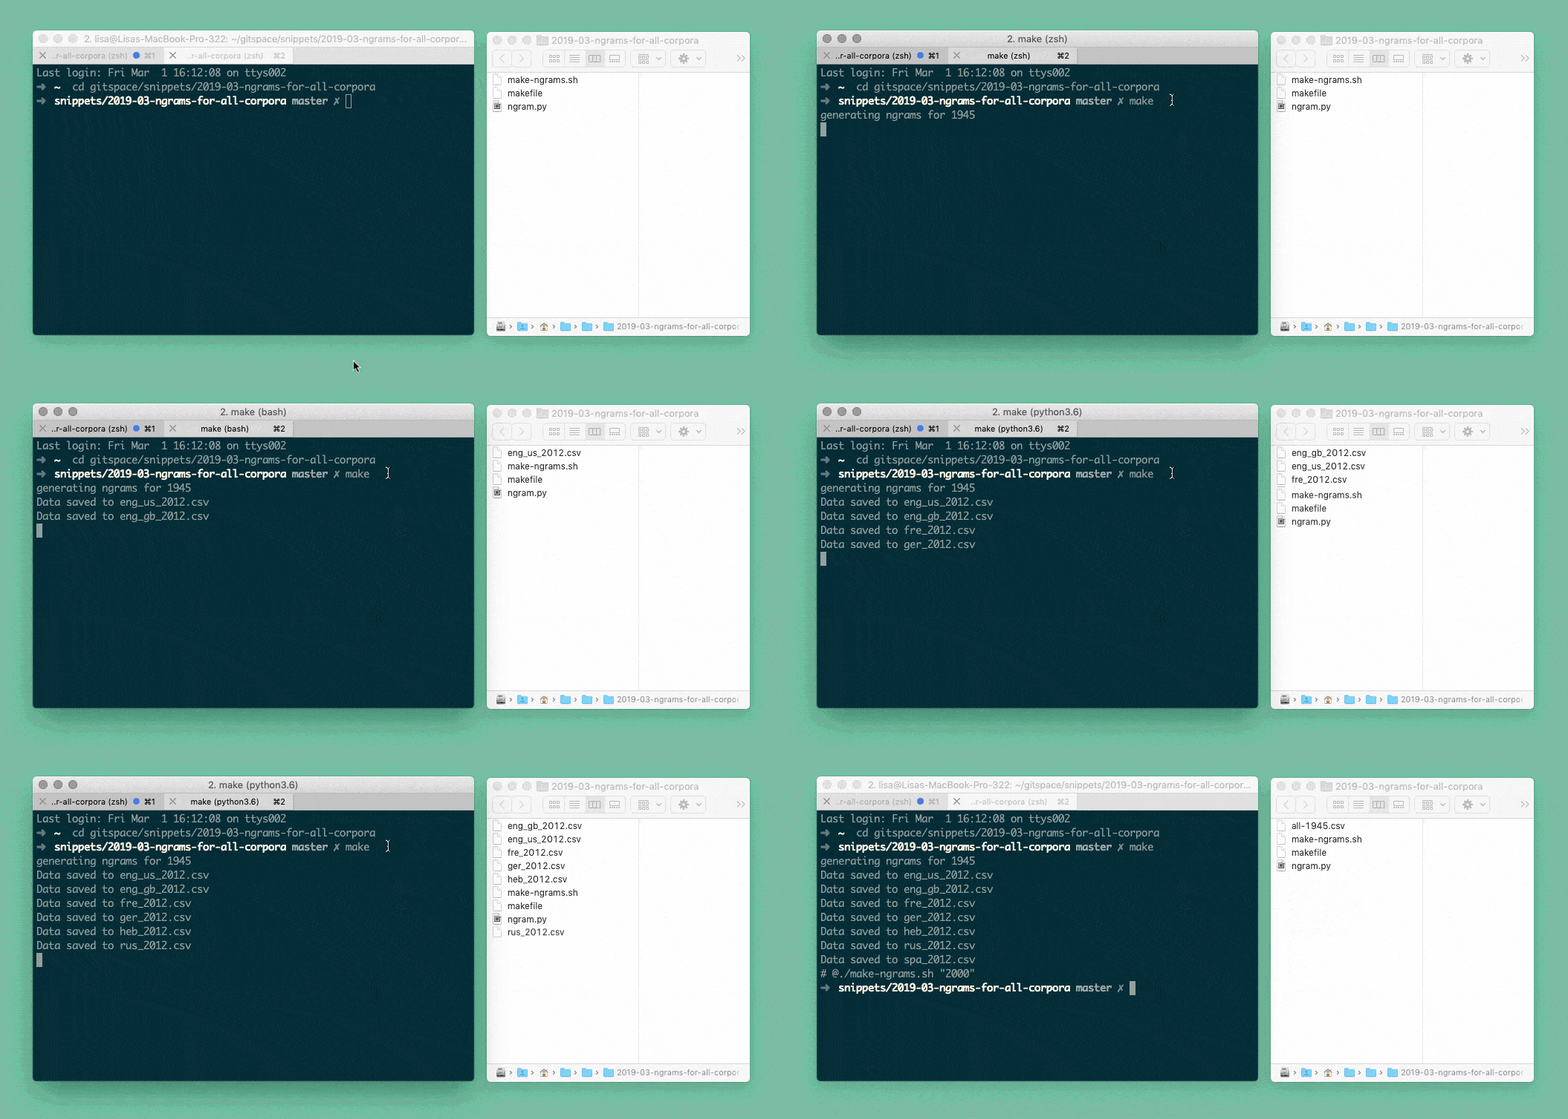
But because it’s a bit exhausting doing this for all our different languages by hand, my coworker Gregor helped me write a Bash script. We tell the script “Please do the thing we just told the Python script to do for the French language and also for the English language, the German language, the Russian language, …”. So the Python script starts for French, then it generates a csv, then it starts again for English and generates a second csv, etc:

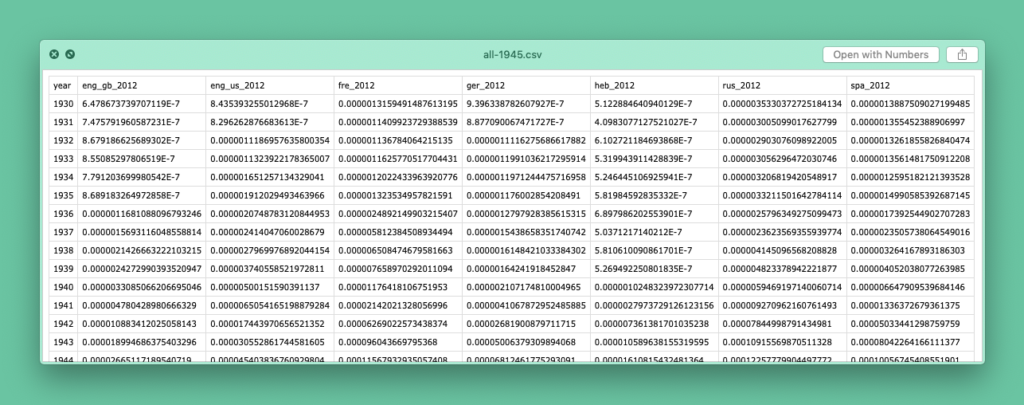
But because it’s also exhausting to join these final csvs by hand, the Bash script does that for us with a tool called csvkit. That’s why at the end of the GIF above, you can see all csv’s disappearing into one csv, all-1945.csv. Here’s what it looks like:

You can find the whole code in this Github repository. Clone it, open your terminal and type “make” to run it for yourself.
Next week I’ll be on vacation – so my coworker Elana, who brought you this Weekly Chart gem a while ago, will take over. Thanks, Elana! And I’ll see you all in two weeks.
Comments