This article is brought to you by Datawrapper, a data visualization tool for creating charts, maps, and tables. Learn more.
Infamous tweets

Hi, Elana here. At Datawrapper, I’m typically found on the other end of our support@datawrapper.de inbox, helping you with all your charting, mapping, and data-wrangling questions.
In past Weekly Charts, I pushed Datawrapper to its limits, seeking out ever weirder ways to force it to do things things that it isn’t built (and most certainly isn’t meant) to do.


Scatterplot 
Bar chart 
Line Chart 
Map


This week, I decided to visualize actual data for once. Sounds easy enough. Except what I wanted to achieve isn’t directly possible (yet!). Undiscouraged, I pushed on, figuring I could reapply some of the hacks from my ChART pieces.
The Dataset & The Inspiration
Donald Trump’s tweets are something of a phenomenon, amassing quantities so large (23,852 and counting), they’ve long since become a dataset begging to be visualized. I’m not the first to have the idea. In fact, this post was inspired by a flurry of recent activity on this topic, in particular this Reddit post and this tweet.
Indeed, this post wouldn’t even have been possible, hadn’t it been for others’ dedication to this topic, and the resulting existence of the Trump Twitter Archive: a scraped online database of all of @realDonaldTrump tweets that forms the basis of this post.
So without further ado, if you ever wondered what Trump’s tweeting behavior looks like from a bird’s eye view, here’s your answer.
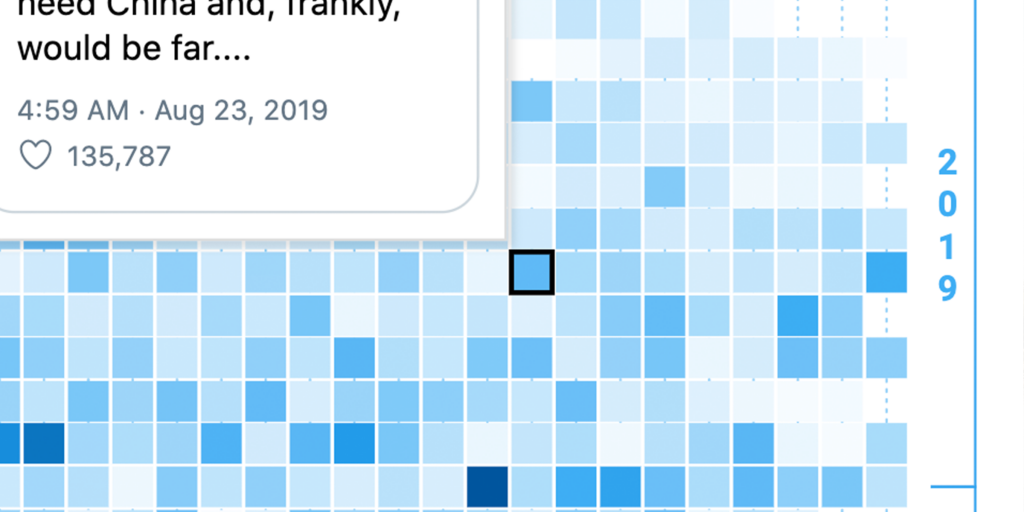
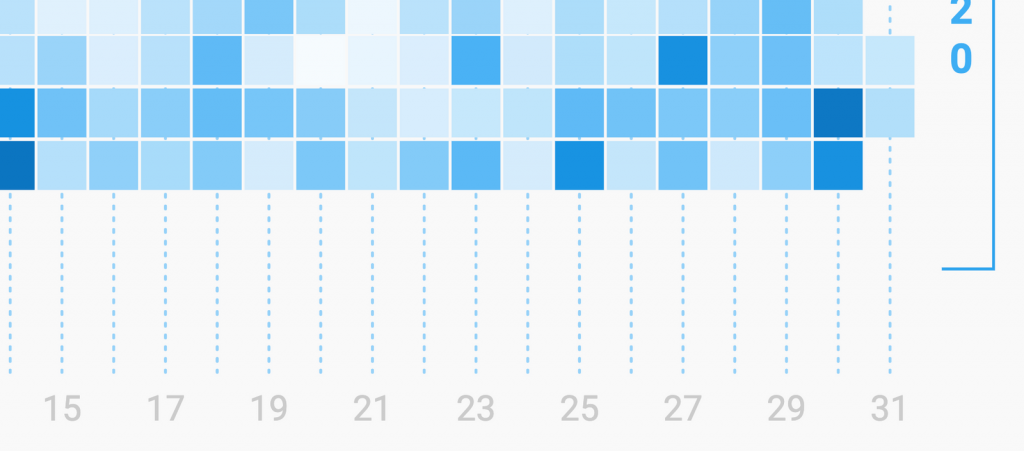
Each of the squares in the chart below represents one day of Trump’s tweets during his presidency. The darker the color, the more tweets he posted that day.
In the past year, @realDonaldTrump has broken all his tweet records
@realDonaldTrump tweets from 2017 until today
Notice how the squares start getting consistently darker as you move down ↓ the chart and forwards in time?
The conclusion is pretty clear. Donald Trump has upped the ante on tweet volume over the past year, hitting his all-time daily record of 166 tweets (in one day!) a few months ago.
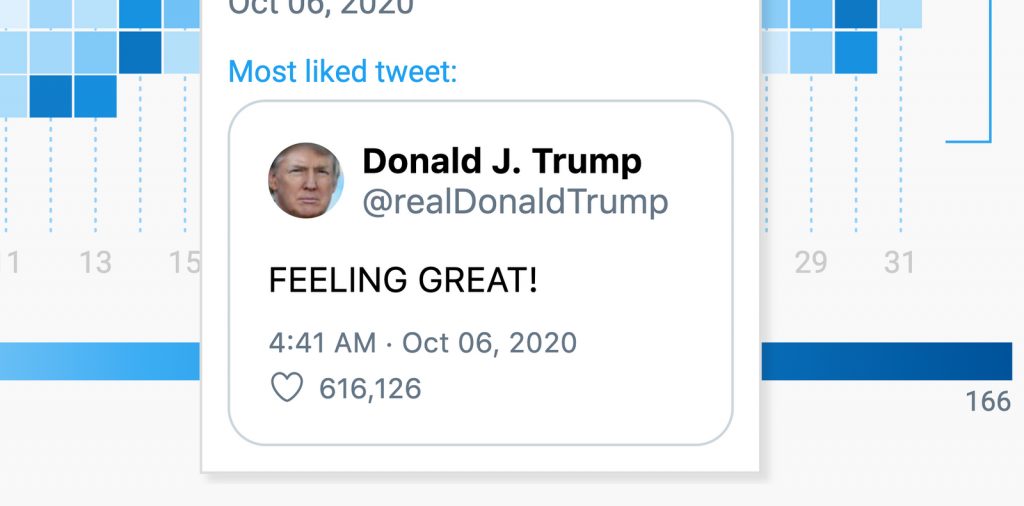
Hover over the chart to see exactly how many tweets he posted on specific days, and for a peek at that day’s most popular tweet.
Okay, but do people like them?
You may, as I was, also be wondering how those tweets are received. As it turns out, it looks like tweeting more is working. In the past year, Trump’s been hitting higher numbers more consistently than ever before.
Notably, the reaction to his COVID-19 diagnosis more than doubled his previous like record. There’s rather less excitement about his recovery, although it still remains his second-most liked tweet by a long shot.
Just for fun
I also had a quick look at the frequency of use of certain specific words. Apparently, Trump has tweeted about Democrats, more than twice as much as he’s tweeted about Republicans (and just a bit more than he’s tweeted about himself). You’ll also find an exclamation mark in more than half of his tweets.
And finally, in case you were wondering what device all those tweets came from, well, it turns out overwhelmingly from an iPhone. I guess that (at least partially) explains the frequent typos.
The making of
For all the heavy lifting, I wrote a couple of node.js scripts that took care of most of the steps in this process:
1. Pulling the data
This whole post would not have been possible (or would have certainly required way more work) if it weren’t for Brendan Brown’s Trump Twitter Archive, a complete[1] archive of all of Trump’s tweets, including deleted ones, scraped from Twitter once every minute.
The data turned out to be available in neatly organized JSON arrays for each year of tweets. I combined the data for the years 2017 – 2020 and wound up with a 237,816 line 10.2MB array of JSON objects. Each looking something like this:
{
    "source": "Twitter for iPhone",
    "id_str": "869766994899468288",
    "text": "Despite the constant negative press covfefe",
    "created_at": "Wed May 31 04:06:25 +0000 2017",
    "retweet_count": 127507,
    "in_reply_to_user_id_str": null,
    "favorite_count": 162788,
    "is_retweet": false
}
2. Analyzing the data
I needed the daily data, but I had a list of every individual tweet. So I had to run through the list and tally up the total for each day, as well as collecting other interesting information along the way: Which tweet was most liked? How many likes? How many retweets? Etc.
3. Creating the csv
Wanting to create a heatmap (specifically, to recreate what Redditer PTDeane had done before me in Excel & Adobe Illustrator) except interactive and using Datawrapper, I faced my next challenge: What to do, when I’m missing the feature I need?
The answer to that question is, and always will be: Use a scatterplot. The flexibility that you have on position, shape, and color of all elements means that, with enough will and creativity, you can get it to do almost anything you want.
In order to create a scatterplot that looks like a heatmap, I needed a dataset with one row for each day of tweets, with:
- A column for the day of the month (that determines the position of each square along the horizontal axis)
- A column for the year/month (that determines the position of each square along the vertical axis)
- A column for the number of tweets, represented as colors.
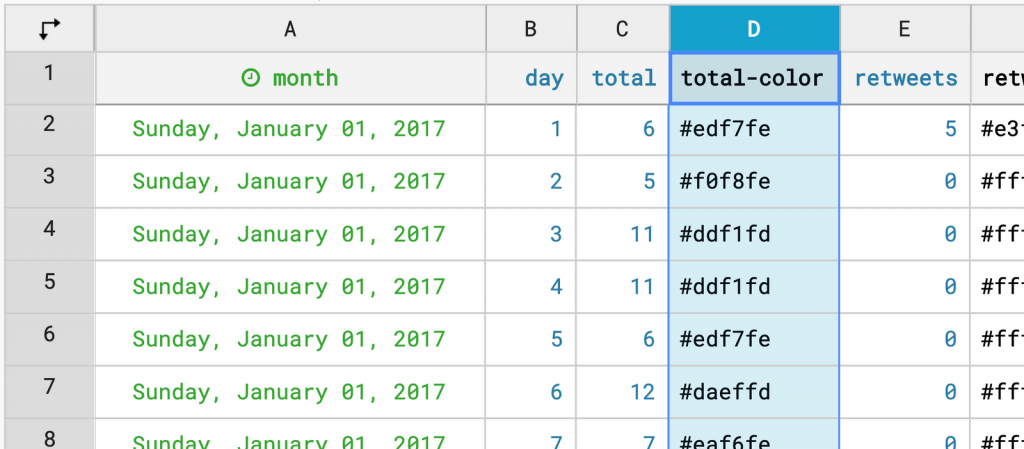
I also included some additional columns that I could use in the tooltip (plus some just to play around with different ways of visualizing the dataset).
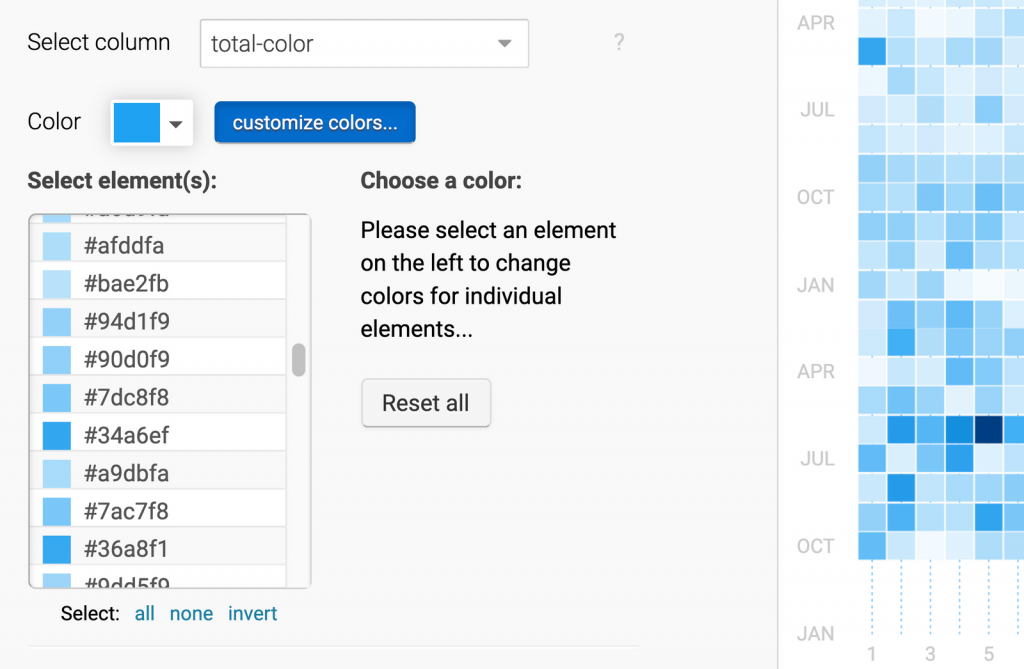
The trickiest[2] bit was the colors. To create the heatmap effect, I had to map each of the daily total values to a color. I did that using a combination of d3.js functions.
4. Creating the chart
Now that I had all the ingredients, the last step was to create the chart, which I did using the Datawrapper API. This was useful for setting the colors, which would have been a lot of work had I done it by hand!
4. Final touches
Finally, I opened up my chart in Datawrapper to finish it up, making generous use of the feature for drawing custom lines and areas for the gridlines and year indicators.
And I made the most of the possiblity to add HTML and CSS to charts, in particular for the tooltip, and my custom gradient legend.
I also eventually added these details to my scripts, so that I (or you) could quickly and easily reproduce the chart, update the data, and color scale (although that won’t change until he breaks his 166 tweet record!)
I would note, that if you find yourself needing a streamlined, automated workflow for pulling data, analyzing it, and creating charts with the Datawrapper API, other tools, like R (there’s a Datawrapper package too!) may well be a better fit.
I hope you enjoyed this! If you made any observations about, or are curious about any other details of Trump’s tweeting behavior, let me know! Next Thursday, you can expect a Weekly Chart from my colleague in the Support team, Eddie. Stay tuned! And see you next time (or in the support inbox!)
- Okay, so not 100% complete. According to Brendan, the archive is missing approximately 4000 tweets and doesn’t have any deleted tweets prior to September 2016. ↩︎
- If I’m completely honest, the trickiest bit wasn’t mapping the colors, but instead getting the heatmap in this article halfway responsive, because the scatterplot symbols have a fixed size and don’t scale down with the chart. And because a scatterplot isn’t designed to retain its aspect ratio, but a heatmap would need both of these things, I had to go to quite some lengths to achieve this (yes, depending on what device you’re viewing this on, you may be seeing a different version of the chart). I also had to implement my own height resizing logic to ensure the aspect ratio is retained. It’s pretty messy, and I probably wouldn’t recommend trying this at home. ↩︎


Comments