This article is brought to you by Datawrapper, a data visualization tool for creating charts, maps, and tables. Learn more.
Fast trains, fast map?

Hi, this is Mirko; co-founder of Datawrapper. Today we’ll explore how many steps are needed to create quite a complex locator map, using the GeoJSON upload option.
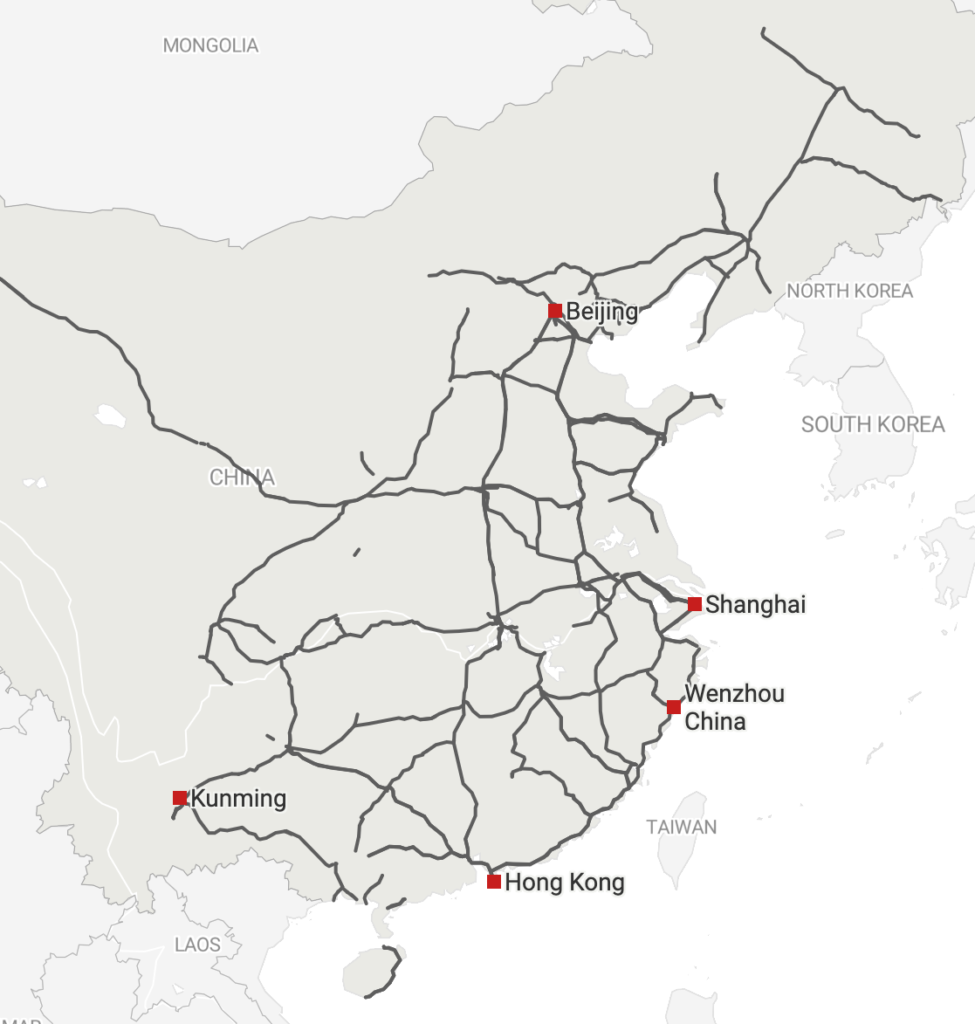
When we started Datawrapper, the goal was to create a tool shortening the time for a journalist to create a bar or a line chart. Simple charts. Today, the tool has evolved quite a bit. So how complicated is it to create a map like the one below? How many steps are needed from the source via the GeoJSON upload to the final map?
Let’s find out. But first, let’s talk a bit about the context of the map:
What’s the story?
Our goal is to visualize High-Speed Rail (HSR) in China. It’s a fascinating story: A little more than 10 years ago, there were just two fast tracks in the entire country: one Maglev train between Shanghai and the airport and another fast train from Beijing to a coastal city.
Today there are 31.000 kilometers of tracks, crisscrossing the entire country and connecting the big cities. Travel times between big cities are short, ticket prices are – relatively – low. 75 million people would only need a one hour train ride to reach Shanghai. The length of fast tracks is more than all other countries in the world, combined.
The table below provides some comparison between the top 10 countries with high-speed trains in the world:
The engineering, the technology, the speed, the size, the (quite strong) politics driving this – for many reasons the growth of the High-Speed Railway system is remarkable and a story worth investigating. The fast train network is a top priority for the government; beyond technological, there are multiple economic, social and political goals. There is much to report and to explore to understand the development fully. Like: How did they do this? At what price (not just the money)? Did they consider ecological aspects or bulldozed the rail tracks through nature preserves? What can other countries learn from this?
It is a story about how one country managed to create complex infrastructure. There is a bigger backstory about politics as the railways are used to string together the many regions of China – including the dissenting ones. So many questions!
But to tell the story, we need a map of the train system.
How to create a map like this?
We can create a locator map with point markers easily – but for our map, we need some lines: Railway tracks. We’ll import these lines as a format called GeoJSON, after downloading & converting them with two helper applications.
So what is a GeoJSON? It’s a format for saving geographical features (like coordinates). We can export geodata such as points, lines, and combinations of these types as GeoJSONs from a resource like OpenStreetMaps.
After a bit of investigation on potential sources for our map, I noticed that to create this map, more preparation than normally is needed. Often, you can download clean GeoJSON files from institutions (this Academy article lists more sources). But for this map, I had to turn to our map professionals Anna and Hans for help. It took them no longer than an hour to extract the needed data from OpenStreetMap.
Step 1: Overpass API
The Overpass API (formerly known as OSM Server Side Scripting) is a read-only API enabling us to query the entire OpenStreetMap database and get selected parts of the map data back. In order to do that we need a query.
You can see how this works below. We query for a specific “way”, meaning only the railway and with the attribute “highspeed”. To do so, we first need to move the map to China:
[out:json][timeout:250];
// gather results
(
  way["railway"="rail"]["highspeed"="yes"]({{bbox}});
);
// print results
out body;
>;
out skel qt;
What we can do then is export a GeoJSON with all the data for the high-speed trains available, including the actual railways, but also e.g. the service tracks at railway stations. Before we can upload this to Datawrapper, we need to clean it up.
Step 2: Mapshaper
Mapshaper is a free tool that’s perfect for this task. It comes as a web app in which you can upload Shapefiles, GeoJSONs, etc; but you can also use it from your command line. Anna did just that. That’s her script to simplify the data of the China High-Speed Railway:
mapshaper -i export.geojson
-clip china_contour.geojson
-filter '["yard"].indexOf(service) == -1'
-dissolve
-simplify 10% keep-shapes
-o china_railway.json
Let’s see what’s going on here. With -filter '["yard"].indexOf(service) == -1', we filter out the service tracks. Together with simplify 10%, that reduces the file size. -o china_railway.json means that after all the clipping, filtering, dissolving and simplifying, we get a tidied file called china_railway.json.
And now we’re done! We can easily upload this GeoJSON into our Datawrapper locator map.
The result
Please note that the tracks shown represent only what has been uploaded into OpenStreetMap so far. The Economist published a map of Chinese high-speed rails two years ago, which looked slightly different:
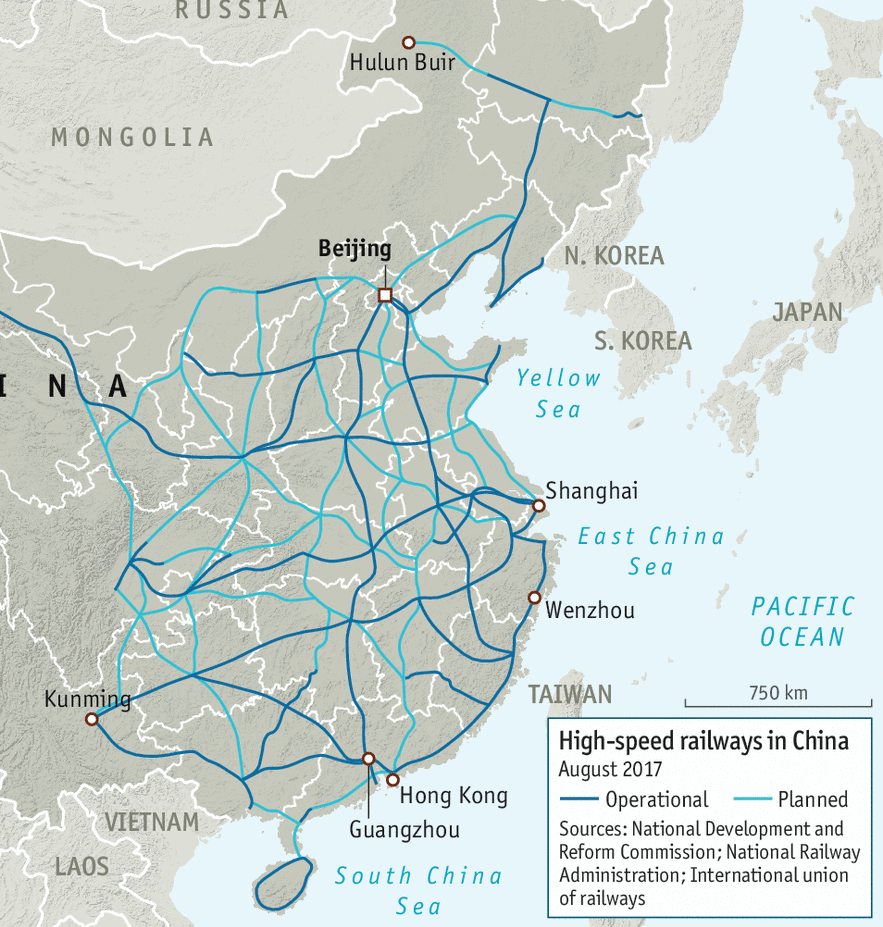
Some extra research would be needed to verify that the map shows all tracks currently completed.
The GeoJSON upload is a powerful, additional feature for the Datawrapper locator maps. In my opinion, this is not “simple” stuff anymore – it is a super-power. If you want to learn more, visit our Academy article “How to import area line markers”. Until next week!


Comments