This article is brought to you by Datawrapper, a data visualization tool for creating charts, maps, and tables. Learn more.
The challenges of visualizing climate change
The ups and downs vs the general trend

Summer in Germany used to be nice. One used to hear “Oh, it’s so warm today! So nice!” exclamations on warmest days. One used to hear complaints about the rainy days in July and August.
My friends, these days are over. The warmth decided to switch to the dark side. It also changed its name: It’s not warm anymore. It’s hot. It’s really, really hot. The summer became our enemy. When did that happen?
Temperatures are data, and since temperatures are such a big topic these days, the data teams in newsrooms are on it. Quartz shows the consequences of the “global heat wave” visually and the Berliner Morgenpost and ZEIT Online both published pieces about the rise of temperatures in Germany. Here is my take on this same data[1]
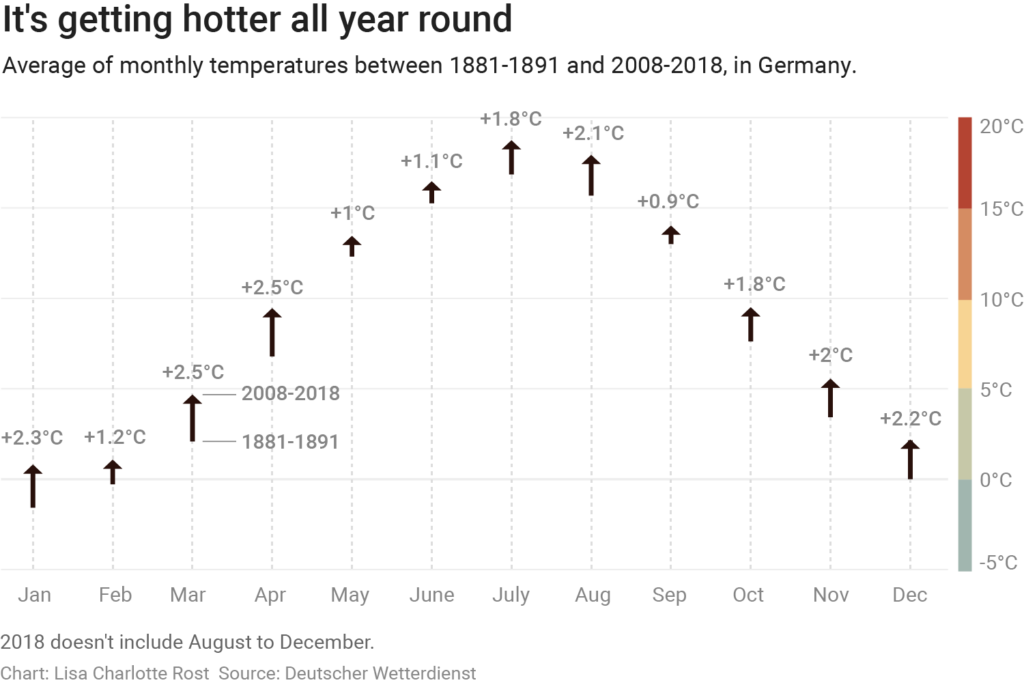
For each month, I calculated the temperature average of the first 10 years in the dataset (1881-1891) and the most recent 10 years (2008-2018). Then I created an arrow plot with the two averages for each month.
It’s a simple chart that shows how the average temperature rose every month, compared with 120 years ago. For example, we can see that on a ten-year-average, it’s now hotter in August than it was in July back then.
Chart Choices: Visualizing slow change
I see two challenges in communicating the increase of temperature that we experience thanks to climate change:
- Small temperature increases of a few degrees Celsius are a huge deal for us in the long-term, but not in the short-term. We are used to temperature ranges of -10 to +30 degrees Celsius and now some researchers and politicians are telling us that an increase of 2 tiny degrees celsius is a big problem. These tiny 2 degrees fight for attention in charts in which we also show the big temperature increases and decreases that humans are used to.
- Normal temperature fluctuations make it hard to see the trend. The months get warmer as a multiple-year-average each year – but it’s not always warmer this year than last year. This year, it is actually warmer. If next year’s summer will be cooler again, nobody will care about climate change anymore, although the danger is still there. Climate change is a slowly creeping long-term development, although it’s existence is obfuscated by it’s many ups and downs.
These two challenges are illustrated by the temperature data looking like this:
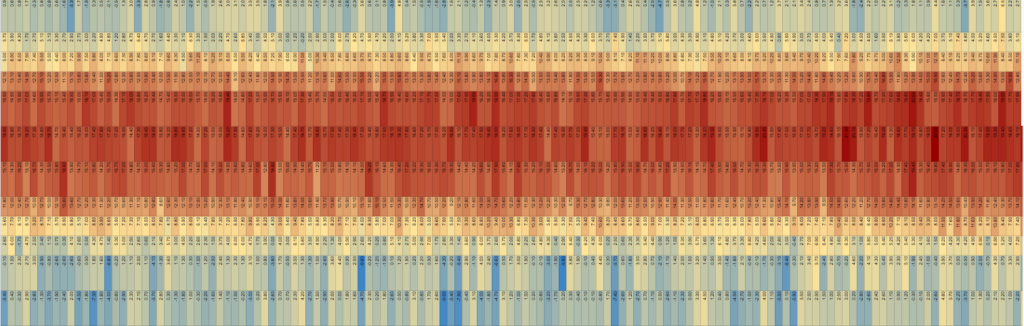
Here we can see the years 1881-2018 from left to right, and each month from January to December from bottom to top. (Have a look at the data yourself here.) I color-coded the average monthly temperatures in Germany. We can see the seasons and very cold (=blue) and warm (=dark red) outliers, but we can’t really see the temperature change over the years.
The same happens when we plot the monthly data as a line/bar chart instead of encoding it with colors. Here’s a chart from the ZEIT Online article:
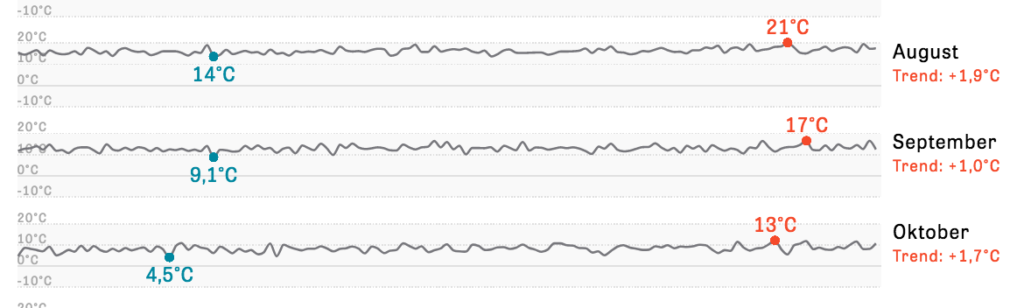
The line doesn’t really show us a trend upwards – we are too distracted by the many ups and downs. But the great peeps at ZEIT Online did something smart: They highlighted the years in which each month was at its coldest 🔵 and warmest 🔴 since 1881. The labels make us see that there has not been a cold record for quite some while.
I tried a different trick to show how Germany warms up: I got rid of almost 120 years. If we can’t see the average temperature increase because of the ups and downs and the many years it takes, let’s remove the ups and downs and the many years. The chart at the top of the article doesn’t look at the slow increase. It asks: If we lived at the end of the 19th century, would we have the same average monthly temperature? (No. No, we wouldn’t.)
In general, I think it’s important to show many perspectives on the same data. The ZEIT Online article does just that. It’s important to show the ups and downs to communicate that they are normal, and it’s important to show the general trend.
Stay cool, my fellow summer-haters. I’ll see you next week!
One can download the data from the German Meteorological Office (“Deutscher Wetterdienst”), but to save some time, I took the data directly from the ZEIT Online article. I used a Google Chrome extension called D3 Deconstructor: With it, you can right-click on a D3.js graphic to get its underlying data.↩︎


Comments