French people are losing confidence in the Paris Olympics
March 28th, 2024
3 min
Datawrapper lets you show your data as beautiful charts, maps or tables with a few clicks. Find out more about all the available visualization types.
Our mission is to help everyone communicate with data - from newsrooms to global enterprises, non-profits or public service.
We want to enable everyone to create beautiful charts, maps, and tables. New to data visualization? Or do you have specific questions about us? You'll find all the answers here.
Data vis best practices, news, and examples
100+ articles that explain how to use Datawrapper
Answers to common questions
An exchange place for Datawrapper visualizations
Attend and watch how to use Datawrapper best
Learn about available positions on our team
Our latest small and big improvements
Build your integration with Datawrapper's API
Get in touch with us – we're happy to help
This article is brought to you by Datawrapper, a data visualization tool for creating charts, maps, and tables. Learn more.
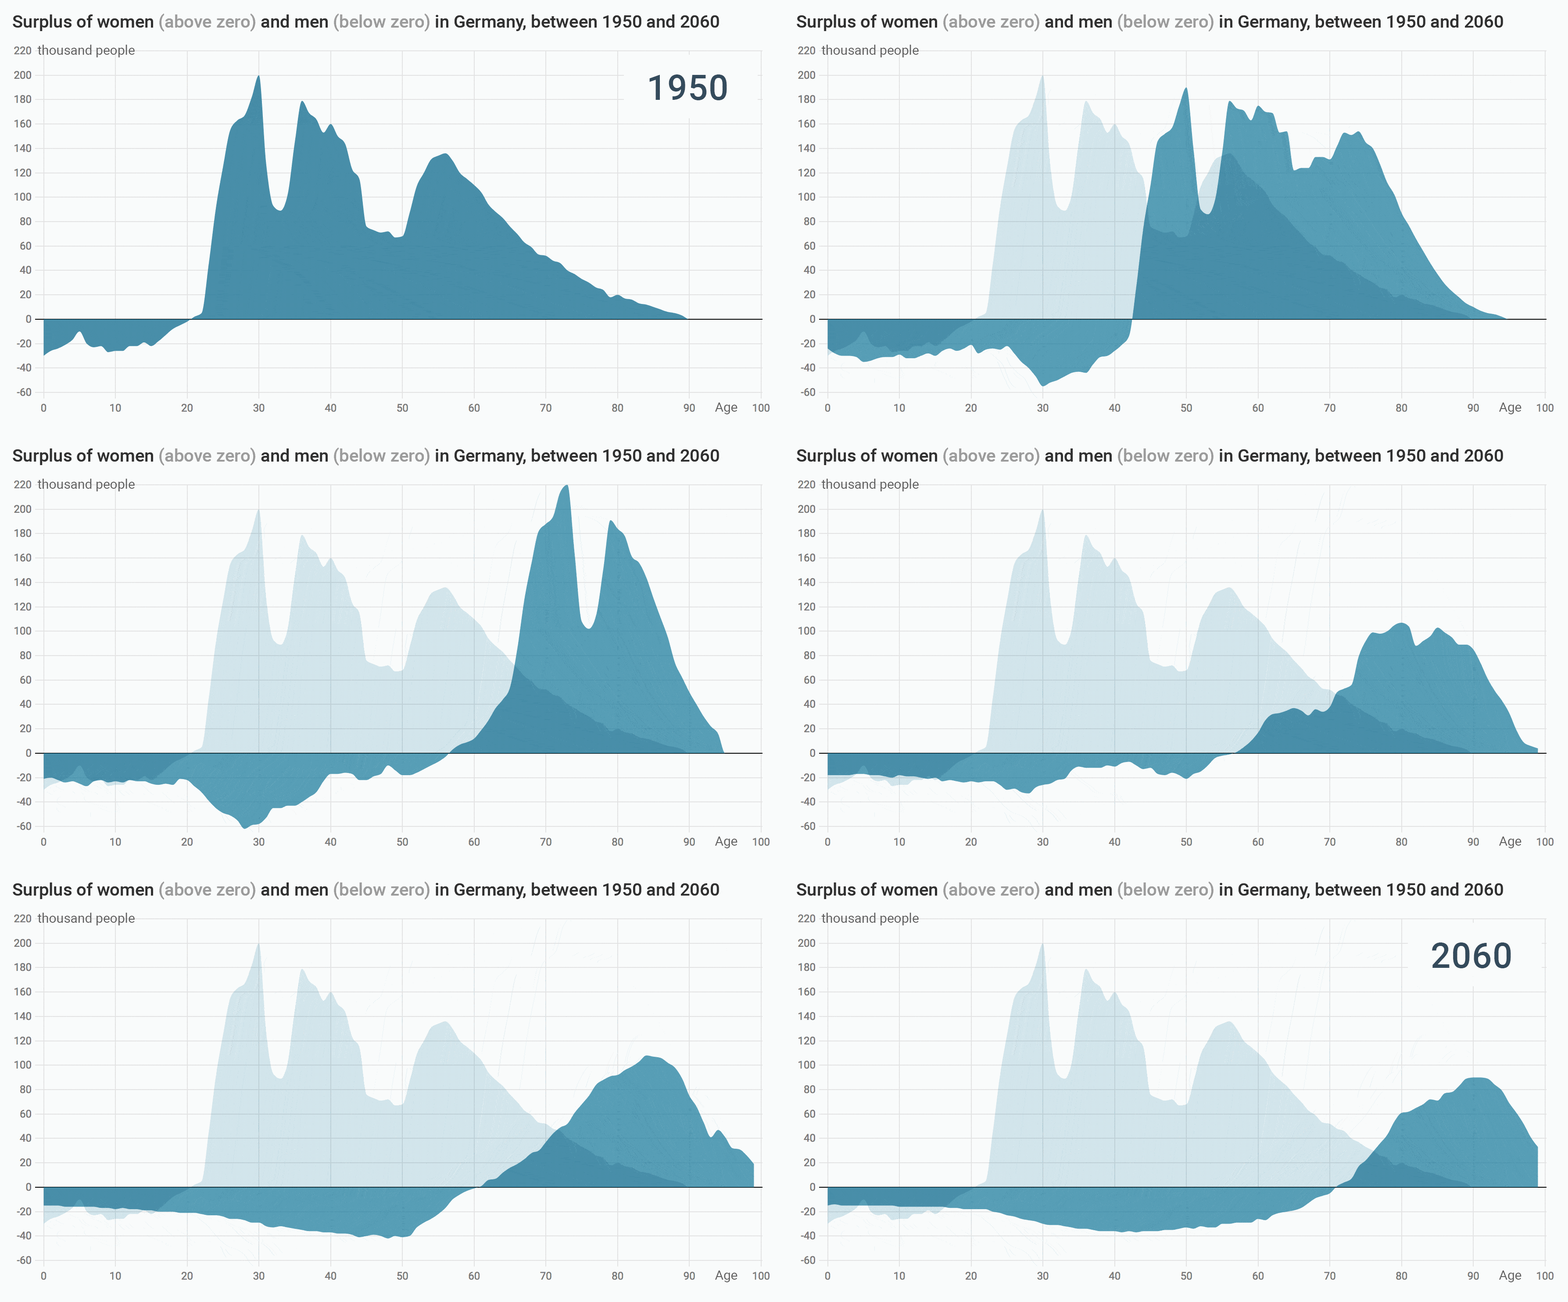
This week’s chart is based on one of my favorite datasets and data vis tools out there: the population numbers in Germany between 1950 and 2060. Indeed, I like it so much that I already created one of my first Weekly Charts with it: “A rusting fountain of youth in Germany”. Here we focus on a different story in the same data:
We can take away many things from this chart: For example there are more boys than girls born in Germany (and indeed everywhere). There is a big surplus of elderly women thanks to their higher life expectancy. It is also possible to see that women did not become as old in 1950 as they did in 2018. And since the blue area above zero is bigger than the blue area below zero, we can see that there are more women than men in Germany these days.
Yesterday, I used the German population numbers to write a new Academy article on how to create a population pyramid with Datawrapper. A population pyramid always looks iconic, but it’s hard to actually compare its left and right side (the numbers of men and women) with each other.
But then I remembered a chapter of Tamara Munzner’s “Visualization Analysis & Design” about derived (calculated) data. And yes, of course, I’m mentioning this book to talk about the Data Vis Book Club again that happened yesterday, in which Tamara herself answered all our questions about this very book😍. She writes in her book: “When you are faced with a dataset, you should always consider whether to simply use it as it is, or to transform it to another form.” So I did just that. I considered that I was interested in comparing the number of males and females in Germany in 2018 with each other. To do so, a population pyramid wasn’t the best choice. Instead, I calculated the difference; to make one number out of two. And since I only showed one number per age for 2018 instead of two, I had space in my visualization to compare this year with another one.
Edit: Here’s a GIF of the surplus between all years between 1950 and 2060:

If you’re interested in reading Tamara Munzner’s book, you can still join for the data vis book club about the second half of the book. We’ll decide on a date tomorrow – follow @datavisclub to hear it there first.
Comments