Radish to romanesco: A year in vegetables
February 20th, 2025
4 min
Datawrapper lets you show your data as beautiful charts, maps or tables with a few clicks. Find out more about all the available visualization types.
Our mission is to help everyone communicate with data - from newsrooms to global enterprises, non-profits or public service.
We want to enable everyone to create beautiful charts, maps, and tables. New to data visualization? Or do you have specific questions about us? You'll find all the answers here.
Data vis best practices, news, and examples
250+ articles that explain how to use Datawrapper
Answers to common questions
An exchange place for Datawrapper visualizations
Attend and watch how to use Datawrapper best
Learn about available positions on our team
Our latest small and big improvements
Build your integration with Datawrapper's API
Get in touch with us – we're happy to help
This article is brought to you by Datawrapper, a data visualization tool for creating charts, maps, and tables. Learn more.
When pride and national identity trump logic.
Hi guys, this is Elana from Datawrapper and I’m making a guest appearance here in Lisa’s absence. We at the Datawrapper office are really excited right now because yesterday we released an awesome new mapping feature: Locator Maps! Well I guess it’s no surprise that this week’s Weekly Chart had to show it off. If you want to read more about their functionality, take a look at the dedicated locator map blog post. Or if you feel like it you can just go ahead and make one yourself.
Whilst it was nature and millions of years of natural history that defined the natural borders, boundaries and shapes of the world we know today, it was human history – characterised by all its distinctly human foibles – pride, violence, competitiveness and territoriality (to name a few) that defined the administrative borders that really frame our world.
Now pretty often people can get very upset about these borders. In fact, isn’t almost all news these days somehow related to these invisible lines?
Well for this Weekly Chart I decided to turn this on it’s head for once. Let’s take a look at a case where borders, rather than being surrounded by difficult topics instead shed a light on a more comical side of our human idiosyncrasies.
And what better way to do this than to make use of our awesome new feature! Locator Maps!
Inspired by this collection of unusual country borders. Let me present to you. The Netherlands inside Belgium inside The Netherlands! Yes. It’s Netherlands inception.
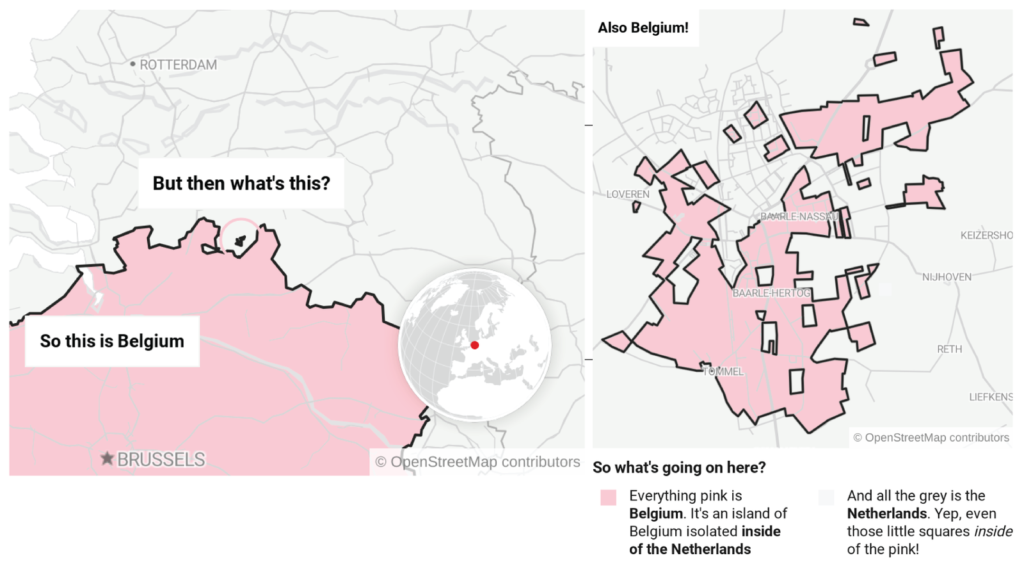
Well, without going too deep into the complicated and winding history of past allegiances to dukes, lords and kings – suffice it to say that the land was bought, sold, and loaned through many generations to the point where the current land owners felt allegiance to either the Dutch or the Belgian side of the border. When the official borders were finally laid down in the 1843 Treaty of Maastricht, 5732 separate parcels of land had to have their nationality laid down separately – resulting in this bizarre, disjointed jigsaw puzzle that we have today.
Now thankfully these borders are friendly, and actually have some pretty funny repercussions. Due to the fact that some of the borders actually pass through buildings things can get pretty complicated when it comes to tax. In an attempt to solve this issue the Dutch government decided that taxes should be paid according to the country that your front door opened out to. However due to tax differences on either side of the border, some innovative business owners were known to simply relocate their front door so that it opened to the other country!
Ok… So I cheated a bit. This isn’t one Weekly Chart, strictly speaking it’s three. Three perspectives on the same story, all made with one tool – our brand new Locator Maps! (did we mention those yet?) Anyway I wanted to take this as a chance to use and show off as many of its awesome features as possible.
So here you have it – the features that made it possible to create this map:
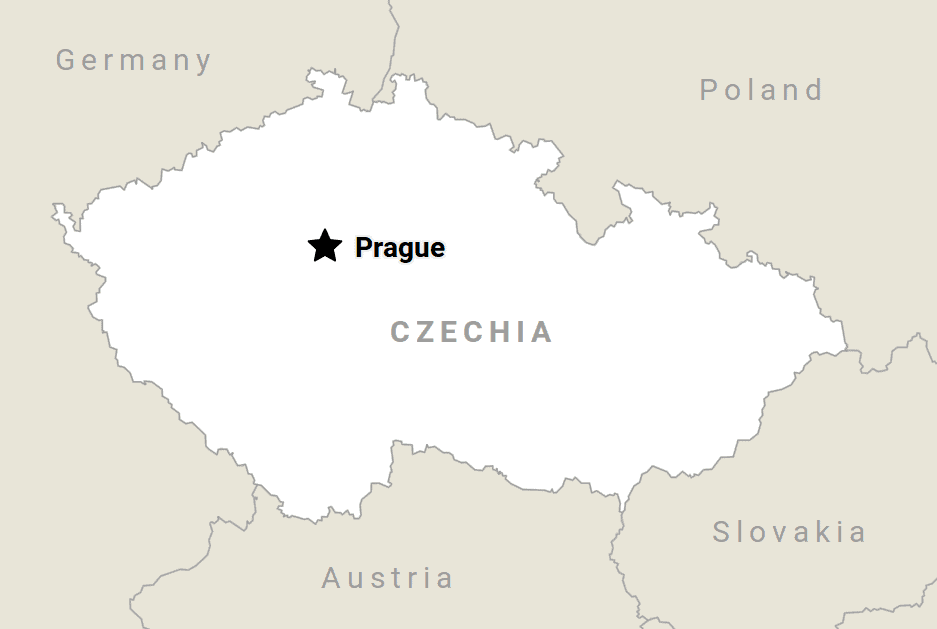
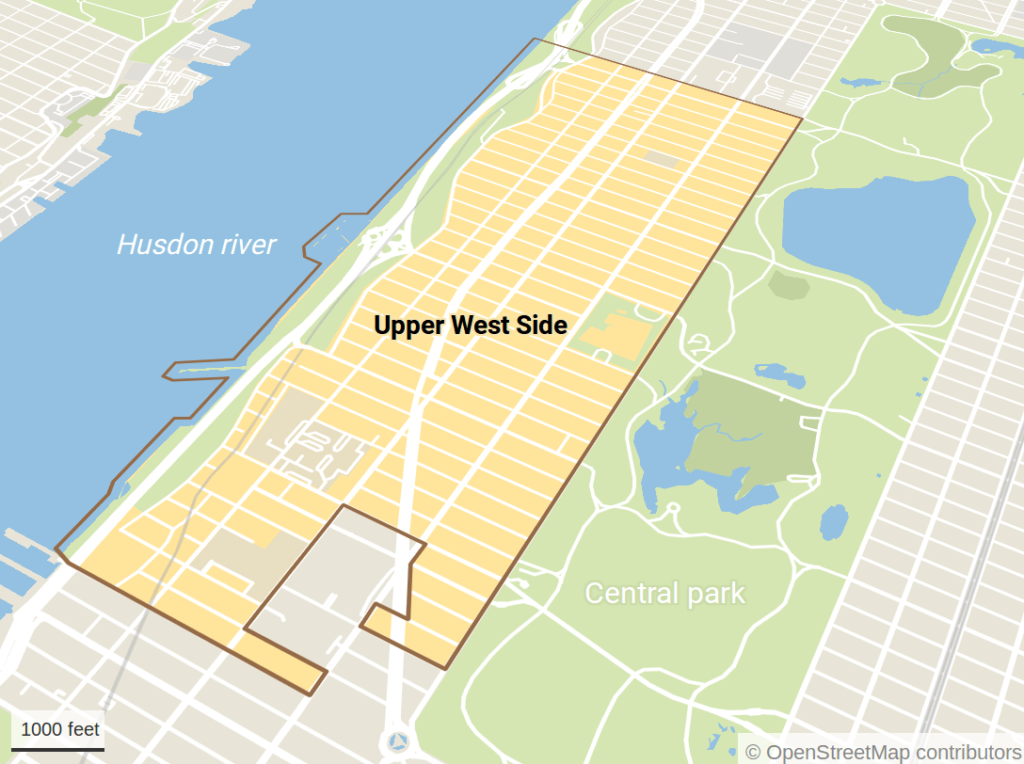


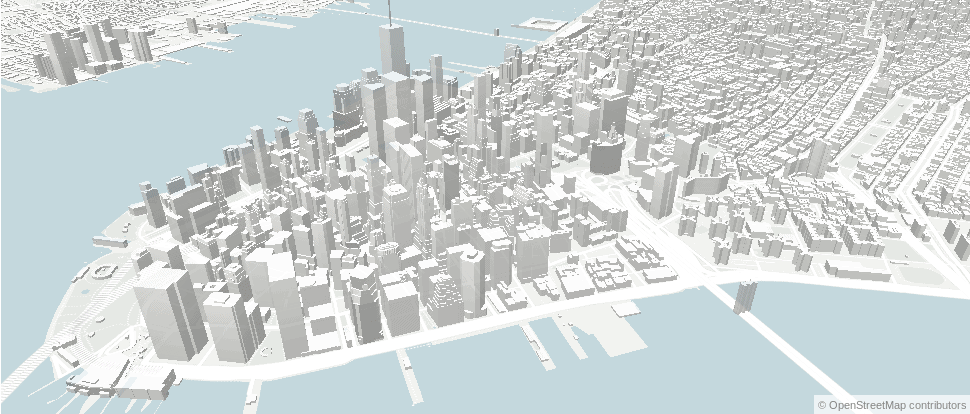
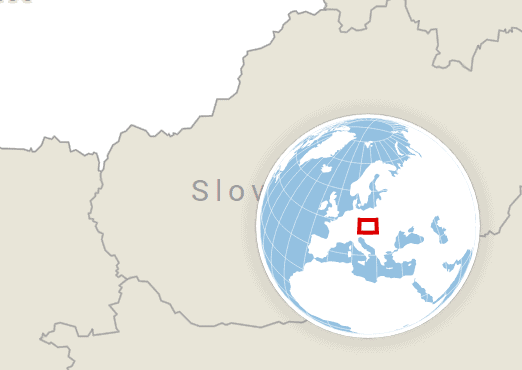
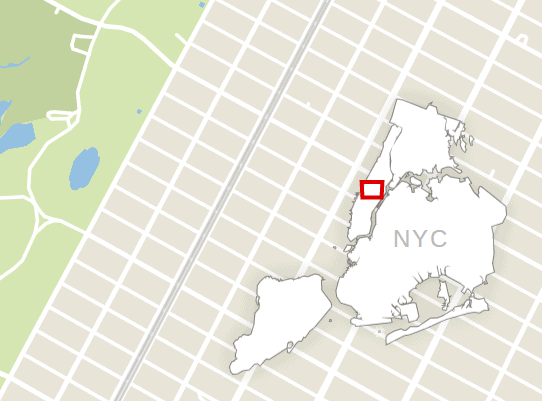
Ok, now that I’ve got your interest, how about you try making your own locator map?
Want to read about all it’s features in more detail? Take a look at the dedicated blog post.
Need help with the tool? We’ve got you covered with a bunch of tutorials in our academy. And if you don’t find the answer you’re looking for there, just shoot us over a mail at support@datawrapper.com.
Ok people. That’s all. Lisa will be back with us next week!
Shoutout to Andy Proehl for compiling this awesome collection of bizarre country borders and his research on their origins. Sources: https://www.flickr.com/photos/amapple/sets/72157616310862857/with/2560802817/, https://en.wikipedia.org/wiki/Baarle-Nassau, http://ontology.buffalo.edu/smith/baarle.htm
Comments