Radish to romanesco: A year in vegetables
February 20th, 2025
4 min
Datawrapper lets you show your data as beautiful charts, maps or tables with a few clicks. Find out more about all the available visualization types.
Our mission is to help everyone communicate with data - from newsrooms to global enterprises, non-profits or public service.
We want to enable everyone to create beautiful charts, maps, and tables. New to data visualization? Or do you have specific questions about us? You'll find all the answers here.
Data vis best practices, news, and examples
250+ articles that explain how to use Datawrapper
Answers to common questions
An exchange place for Datawrapper visualizations
Attend and watch how to use Datawrapper best
Learn about available positions on our team
Our latest small and big improvements
Build your integration with Datawrapper's API
Get in touch with us – we're happy to help
This article is brought to you by Datawrapper, a data visualization tool for creating charts, maps, and tables. Learn more.
One parliament, many elections
Hello, here is Anna. I’m the one gardening the more than 1000 administrative region maps we offer for choropleth and symbol maps in Datawrapper. This week, with help from Lisa, I’m in charge of the Weekly Chart. And of course, I’m making a map!
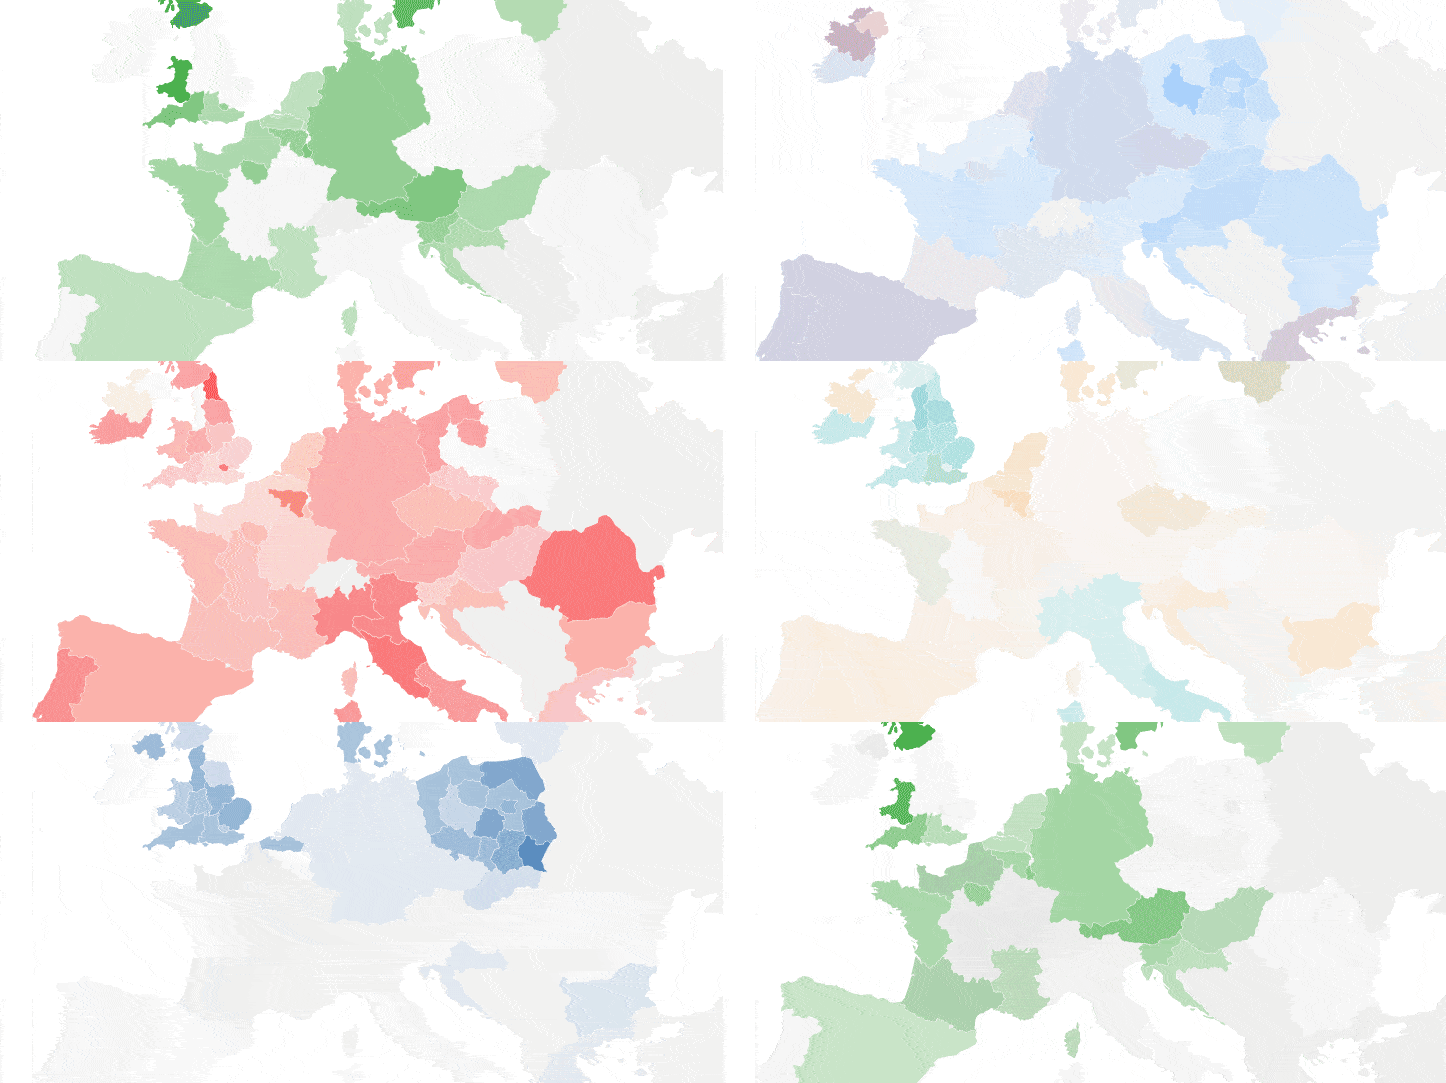
At the end of this month, the member countries of the European Union are electing members of the European Parliament. What a splendid opportunity for me to add some election maps to our map collection, especially since it happens to be Europe Day today[1]! Starting from now, you can create Datawrapper maps of the EU constituencies from 2014, the EU constituencies from 2019 (yes, some constituencies have changed[2]) and the EU member countries. But before you all put the election results into our new shiny new map on the 26th of May, this week’s Weekly Chart shows the results of the 2014 EU Parliament elections:
So how does this EU election work? There is in fact not just one election taking place, as each member state is responsible for their own election of Members of the European Parliament (MEPs). Each state is free to subdivide their country into constituencies, as long as they use proportional representation. The majority of EU countries have a single national constituency where MEPs are elected for the whole country, but Ireland, Belgium and United Kingdom are subdivided into constituencies where results are calculated separately. Poland and Italy are also subdivided, but the number of MEPs per constituency is calculated and distributed after the election.
And here are the results of the election in 2014:
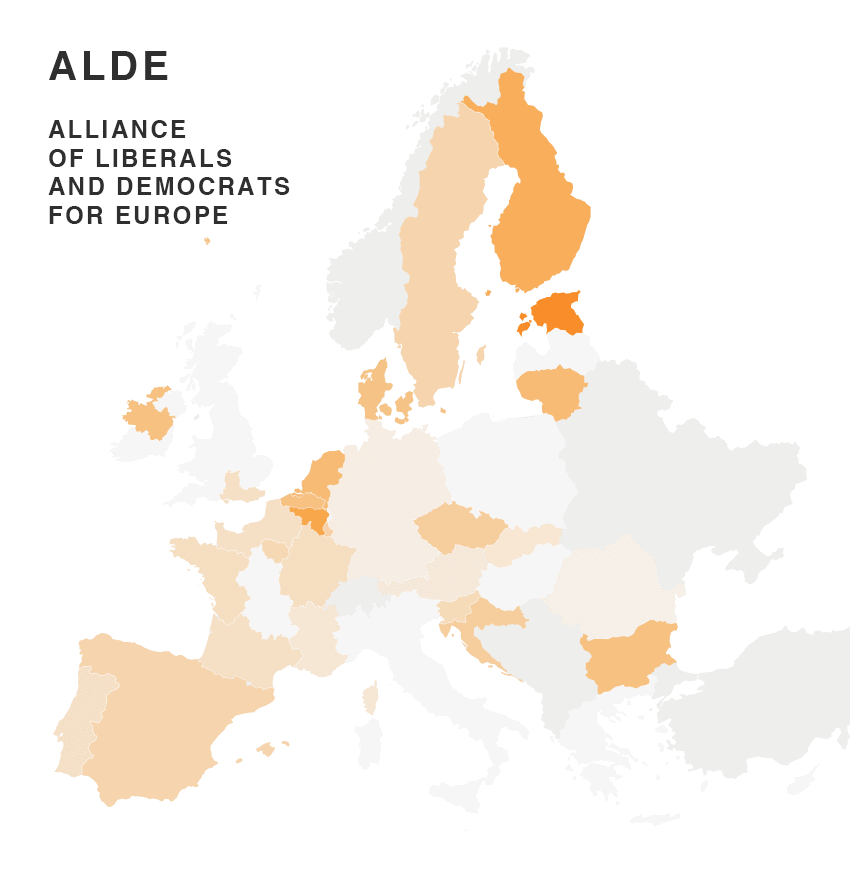
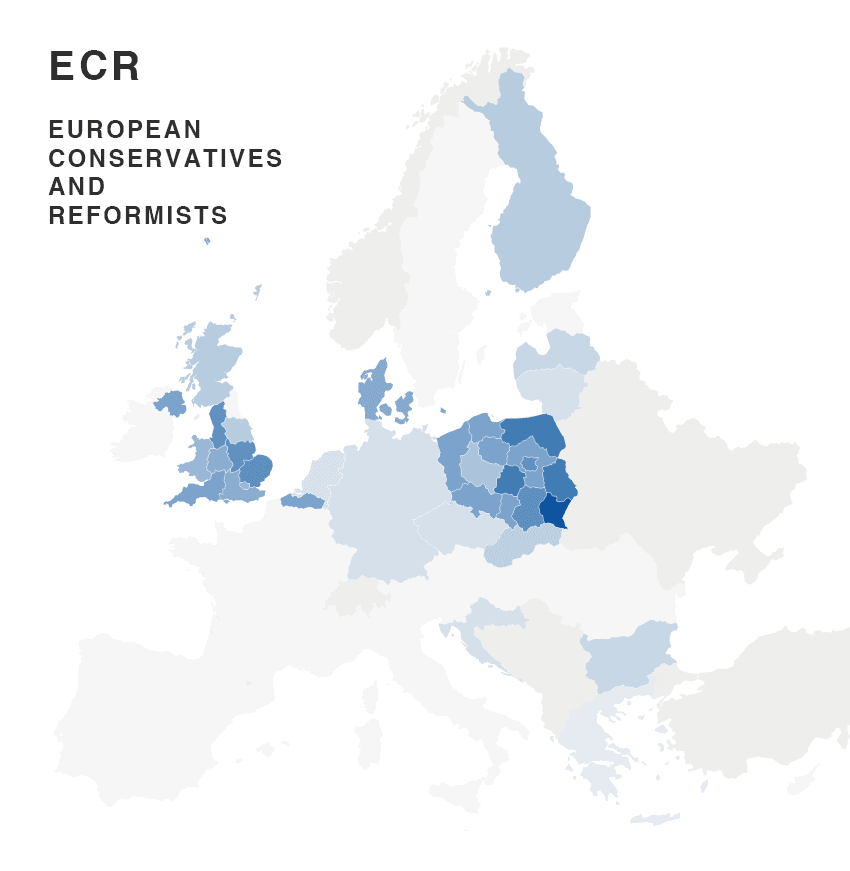
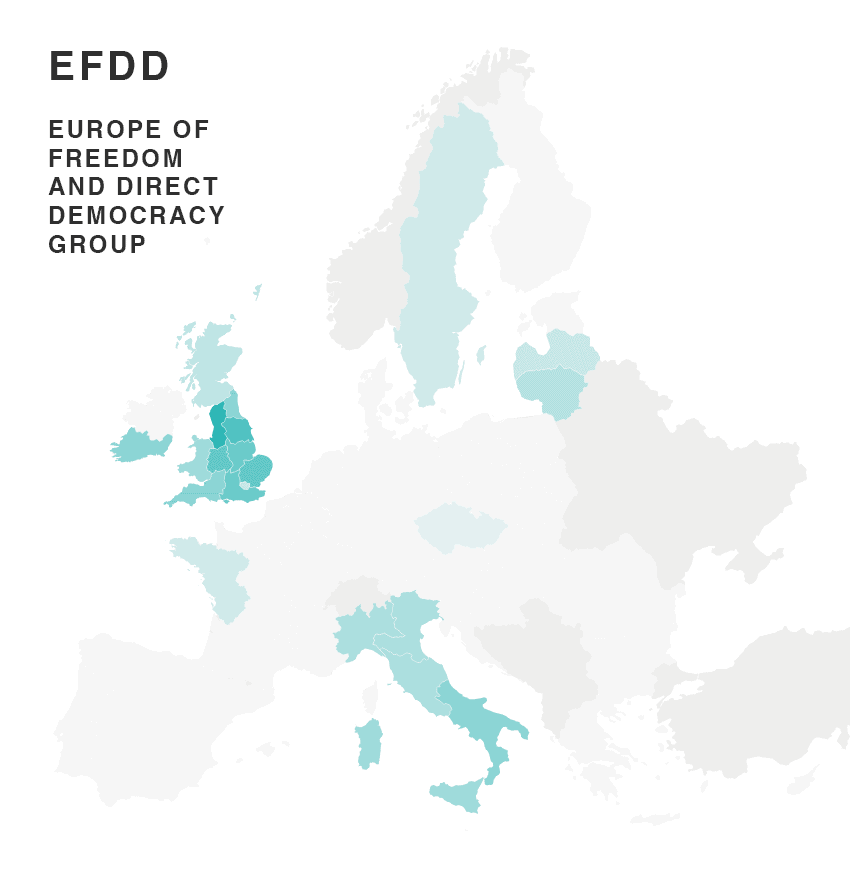
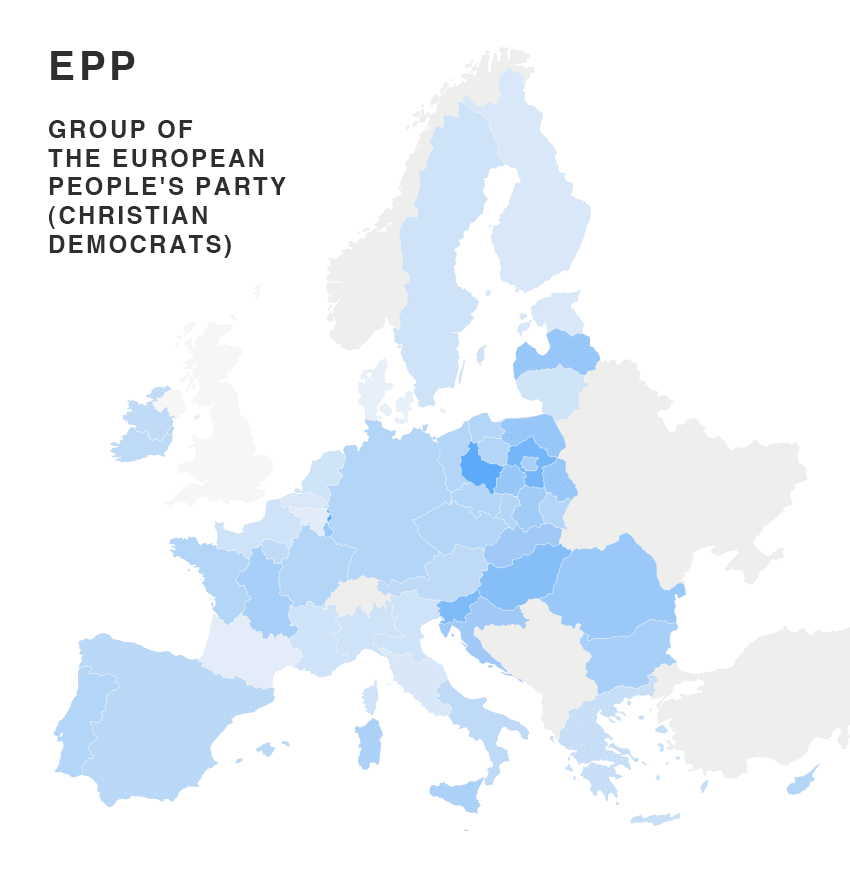
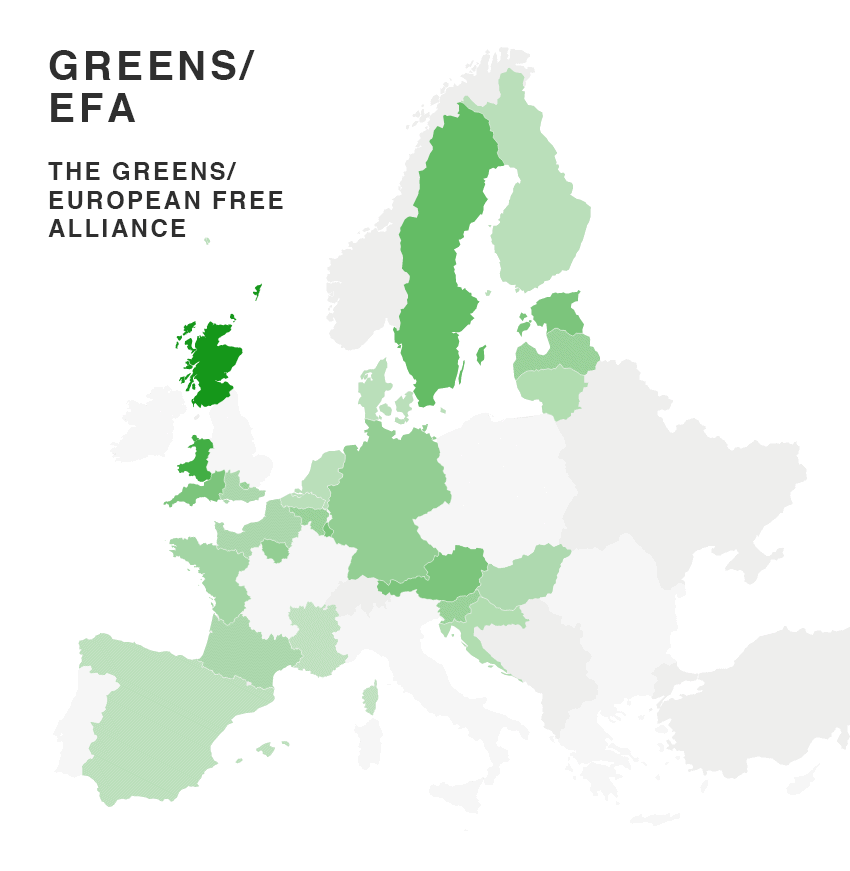
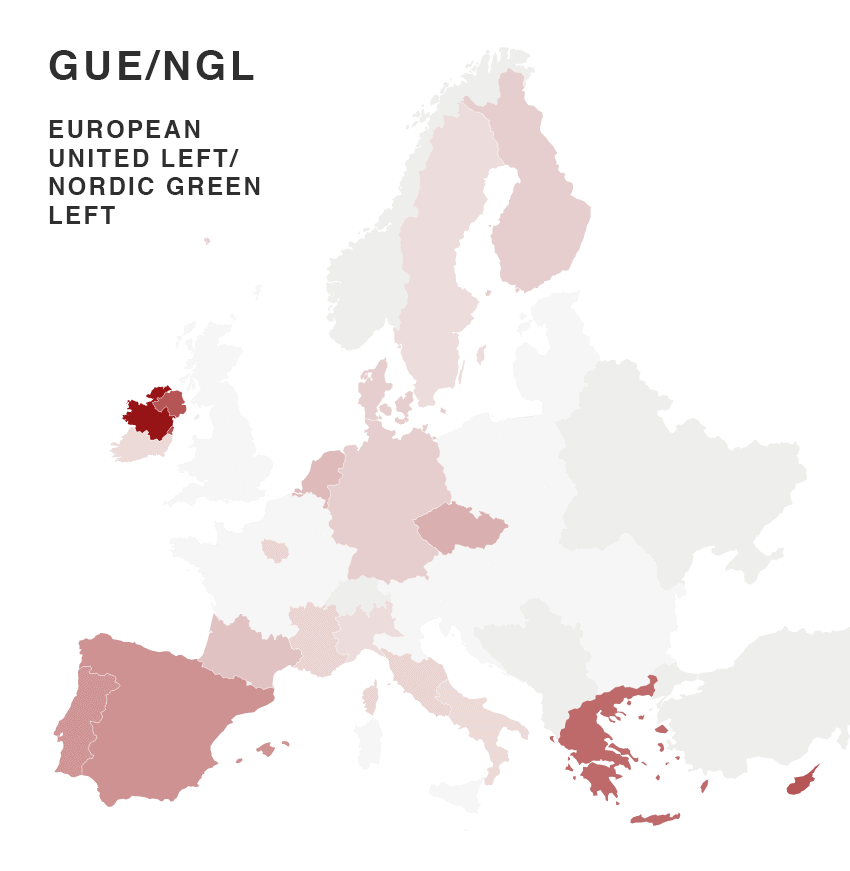
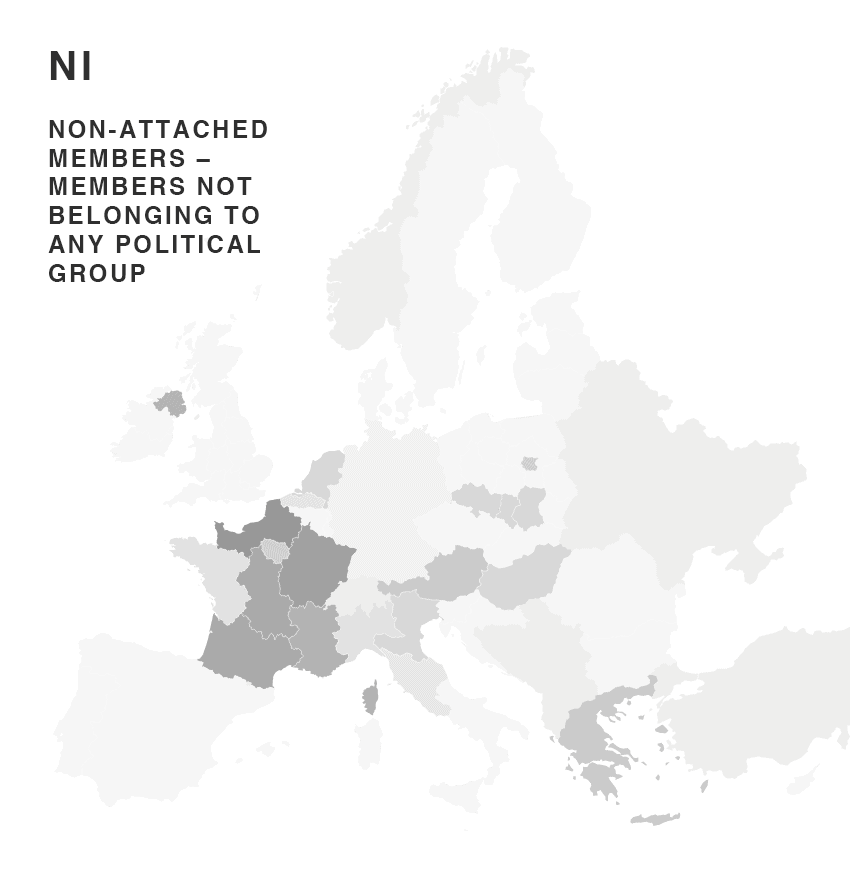
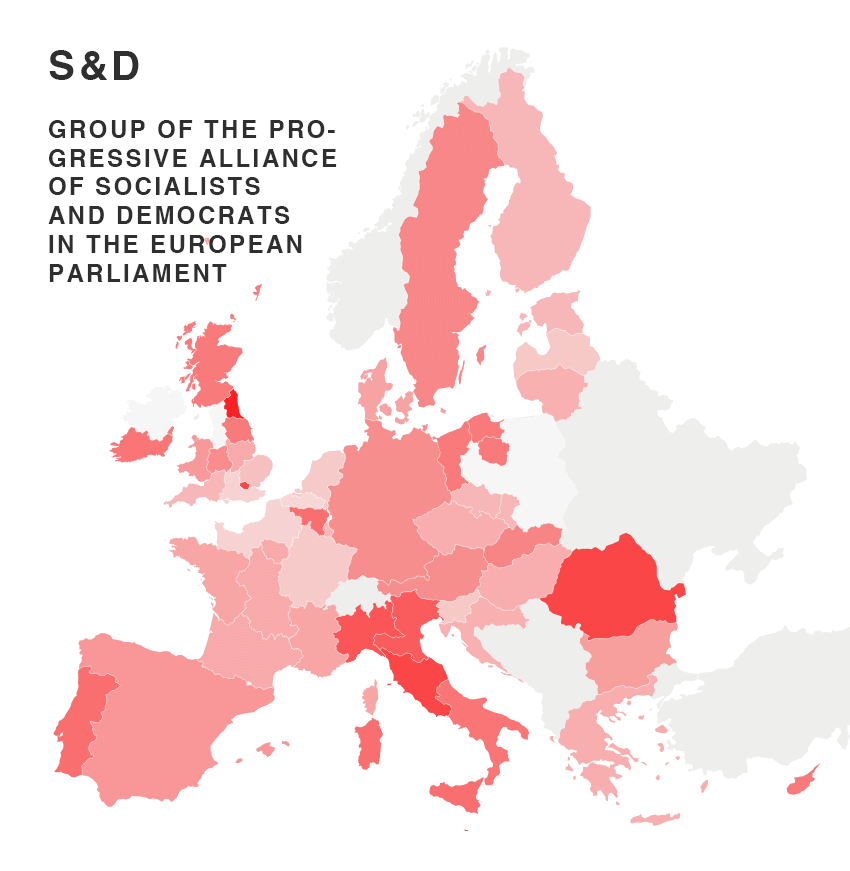
These tiny maps (some would call them “small multiples”) show how popular the political groups in the EU parliament were in the 2014 elections. Small multiples are a good way to compare different variables in the same regions with each other. For example, in Poland the conservative ECR group gained many representatives, but the socialist S&D hardly got any.
And since small multiple maps don’t take away much space, we can show the results of smaller political groups, too: We can see that in France, the NI group (MEPs not belonging to any group) is quite large. And maybe not very surprisingly, UK and Italy elected many MEPs into the EU-critical group EFDD.
I hope you liked this article! If you have any questions or feedback, you can write to me (anna@datawrapper.de). I’m looking forward to hearing from you! We’ll see you next week.
Comments