

French people are losing confidence in the Paris Olympics
March 28th, 2024
3 min
This article is brought to you by Datawrapper, a data visualization tool for creating charts, maps, and tables. Learn more.
Part 2: The chart that can’t start at zero
This is part 2 of a series that explains log scales. Visit part 1 and part 3.
Last week, we opened a candy business to learn about log scales and how they don’t show us absolute numbers, but growth rates. This week, we eat more candy and look at another aspect of log scales: exponential growth & numbers of magnitudes. And we learn about Moore’s Law:
Moore’s Law was the idea of Intel co-founder Gordon Moore in 1965. According to him, the count of transistors[1] on microprocessors doubles every 18 to 24 months. It’s not a natural law: Many proclaim that this law’s end is near, although it has worked well so far as a self-fulfilling prophecy for processor producers like Apple or Intel.
To play around with this chart or embed it in your own articles for free, hover over it and click on “Edit this chart” in its top right corner.
Let’s try to understand log scales a bit better before interpreting this chart with our new-found knowledge:
As we’ve seen last week, log scales are these weird scales where the distance between 0.1 and 1 is as big as the distance between 1 and 10 and 100,000 and 1,000,000.

These marks – 0.1, 1, 10, 100, etc. – show us order of magnitudes; also called powers of ten, factor of ten, or decades. The order of magnitude of 1000 is 3, that’s why it can be written as 103. (In your old school calculator and in programming, it would be 1e3.) You can remember magnitudes easily: Just count the zeros in a number. 1000 has three zeros, so we can write it as 103. The 1 has no zeros, so that’s 100. And a 0.0001 has four zeros and it’s negative, that’s why it’s a 10-4. So the log scale doesn’t show numbers on a linear scale, but it does show the magnitudes in a linear fashion: 0, 1, 2, 3 etc.
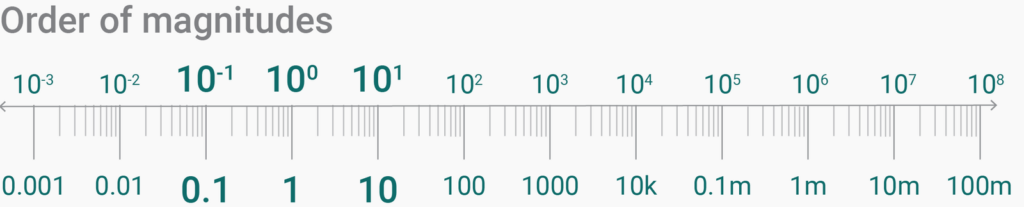
The reason that log scales show us magnitudes is the reason why we can never-ever extend a chart with a log scale to zero: The distance between 0.000001 and 0.0000001 is as big as the distance between 100 and 1000. Or the distance between 00000000000.1 and 000000000000.1. So zero is out of sight. The log scale will never experience the joy of reaching it:

“Exponential growth” is something we know from cell growth, virus spreading, pyramid schemes, economic growth and old stories in which math lovers get rich with wheat grains and a chess board: We’ve all heard the word “exponential” before. Let’s remind ourselves what it means.
Exponential growth means that something doubles/triples/quadruples etc. every minute/day/year etc. Remember your candy business from last week that grew by 100% each year? Each year, you eat double the number of candies you ate last year. This is exponential growth. Each year, you eat two times the number of candies, so the so-called base is 2. The “exponent” (the tiny raised number next to the 2) is equivalent to the number of years:
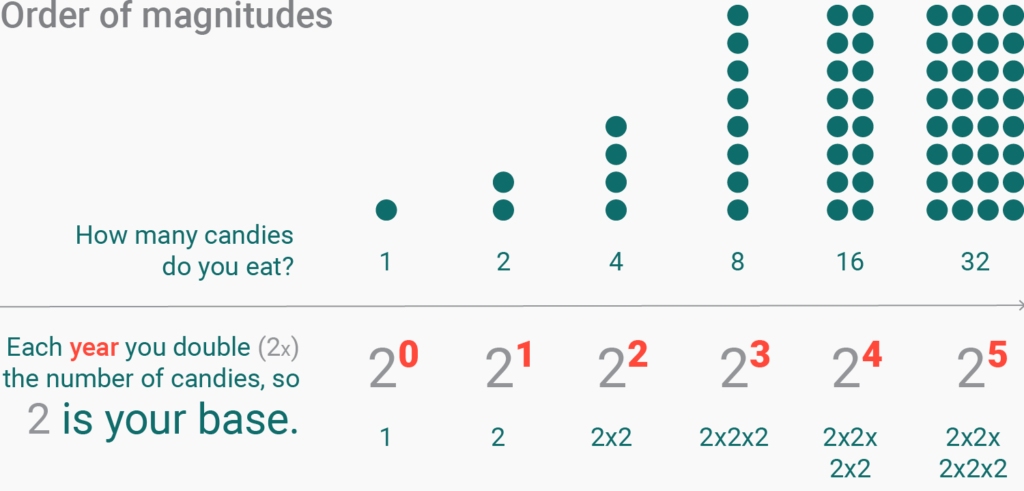
So we have exponential growth every time the exponent grows in a linear fashion. That looks familiar, you say? Yes: The orders of magnitude on our log scale are exponents, too! Here’s where it comes all together. If we replace the base of 2 with a base of 10, it looks exactly the same as the order of magnitudes if you scroll up a bit: 100, 101, 102, etc. Same deal. A log scale is “growing exponentially” if its exponents (= order of magnitudes) are “growing linearly”.
If you show exponential growth on an exponential scale – meaning, our log scale –, the exponential effect evens out. We get a straight line. That means: If you see a straight line in a log-scaled chart, something grows exponentially. Every minute/day/year, the amount of something will double (or halve).
And if something doubles every x years/days/minutes, it will hit the next magnitude in constant time intervals. Which is something I find mind-boggling. But it adds up if we do the math, e.g. for our candy business:
In the first year, we eat 1 candy.
After 3.3 years, you eat 101 = 10 candies.
After 6.6 years, you eat 102 = 100 candies.
After roughly ten years, 103 = 1000 candies.
After roughly twenty years, 106 = 1,000,000 candies.
So we can calculate that after forty years, the magnitude will double again and you’ll eat 1012 candies.
What can we read out of our chart then?
First, we check if it’s a log scale. It is! The y-axis is log-scaled. Then we look at the chart. If we would draw a line through these transistors, it would be a pretty straight line. We can conclude that the transistor count is growing exponentially: It is doubling every x years.
Every how many years? That’s something we can’t really find out without some math – that’s why it’s written in the headline. What we are able to tell just by looking at this chart is that the transistor count goes up by two magnitudes every fifteen-ish years. Meaning, it took 15 years to get from 1000 transistors to 100,000 transistors and it took 15 years to get from 100m transistors to 10b ones.
That was a lot to take in! Next week, we’ll look at log scales again – but in an article that will be a bit more compact. Visit part 3 of this series here.
Transistors are basically the basis of all computing. They are tiny and they do tiny tasks, which add up to you playing World of Warcraft. The more transistors fit on a processor, the faster your computer is – or the smaller the computer can be. Think smartphones, and then think smartwatches.↩︎


Comments