

How to match data with VLOOKUP in Excel & Google Sheets
October 20th, 2021
6 min
This article is brought to you by Datawrapper, a data visualization tool for creating charts, maps, and tables. Learn more.

Hi! This is Benedict Witzenberger , a data journalist at Süddeutsche Zeitung. In my job, I’m trying to find stories in data and write code to automate all kinds of things.To make our stories more appealing and understandable for our audience we’re using a lot of visualizations. That’s why I’ve been working a lot with Datawrapper – for years now. But only a few months ago, I came across their API. They’ve just released a new version of it – for which I wrote a package in the programming language R, called DatawRappr. That’s when Lisa asked me to write a guest post on the whys and hows.
Datawrapper is probably one of those rare tools data journalists can agree on. They all use it – or at least have used it in the past. You can’t say that about the programming languages the people in the community use: Some are evangelists for Python, others for R. But whatever language you code your analysis in – to get data from a script into Datawrapper has always been kind of cumbersome.
The best way was to wrangle your results into a CSV-like form and put it in the clipboard.
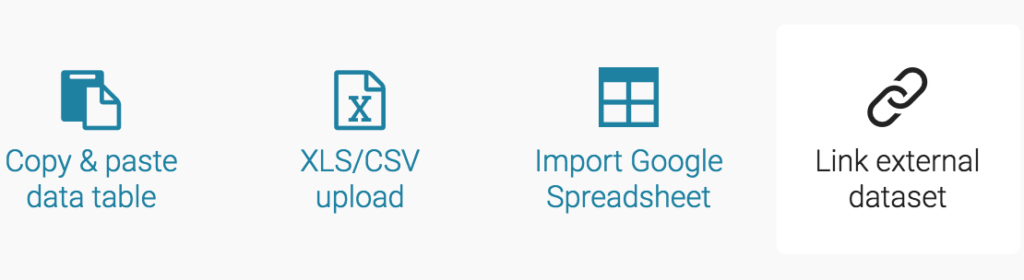
The more common way was more like this: Export your results as a CSV and upload that into Datawrapper. Or upload it to your own web server and use their “Link external dataset”-feature. The latter has a big advantage: This method will update your data once the CSV changes. At least for 30 days, if you don’t hit “Publish” again.
This keeps your data up-to-date, but not the surrounding elements: title, intro or sources are not extracted from the CSV data and are not touched if the data changes. Of course, you could always change those manually. But that’s a lot of work. Let’s look at some examples.
You might want to build a poll tracker (like a lot of media companies do) to keep track how citizens intend to vote on election day.
To do so, you probably get every single poll for the election you want to track and calculate some kind of average. You might want to take the sample size into account, or maybe you want to decrease the impact of older polls over time. In the end, you come up with a number for each party. You then want to update your poll tracker chart and create a custom headline for the chart depending on what it shows. The more effort you put into different possibilities, the better it might get. You’ll also want to add an “Updated at”-timestamp and a text that contains all the pollsters you used for your tracker.
While you can simply upload your calculated average to Datawrapper, it’s not easy to upload your headline, timestamp or source within your script. You still have to open your browser, head to app.datawrapper.de, find your chart and change the lines. A lot of boring, error-prone work. At least the chart looks quite interesting:
Another example: a share price tracker. It basically works the same as a poll tracker, but gets updated a lot more often. So you really need to have an exact timestamp:
To make my point: you want something that helps you to automate things. Datawrapper provides an application programming interface (API) for their services. Instead of making all your changes manually on Datawrapper’s website, you can change everything programmatically.
Datawrapper just released a new version of the API a couple of weeks ago. In the corresponding blog post, I learned that the whole user interface of datawrapper.de is actually talking to this API. So should we.
You can use any programming language to talk to their database with this API, send data to your charts, create new charts or change titles or sources. Like I did for this chart of the snow heights on Germany’s highest mountain, the Zugspitze in Bavaria, which is updated each day at 9 in the morning:
To create this chart, I’m running a script on a web server. It loads an open data file from the German Weather Service that includes a bunch of meteorological data for all of their weather stations. In an R script I calculate the daily changes of the snow height and derive some headline from the data:
I then use my package DatawRappr to talk to Datawrapper’s servers and update my chart. I’ve pushed the full script on GitHub – check it out, if you like.
Introducing DatawRappr – ein API-Wrapper in #rstats für @Datawrapper https://t.co/Ci7Kb3OFwW pic.twitter.com/FgG9mMPcvZ
— Benedict Witzenberger (@munichrocker) December 2, 2019
You can easily use my package to edit every aspect of your charts. But to be honest: I prefer the direct visual feedback I get from changing something on Datawrapper’s web interface. So I recommend using my package to create an empty chart, push your data to it, then head to app.datawrapper.de and finish the visual elements. When you’re rerunning your calculation, you can simply change titles and sources and republish your chart with DatawRappr. Let me show you how it works:
To use DatawRappr, you will need to be familiar with R – at least you should know how to install a package like DatawRappr (There are a lot of free resources to learn R). To talk to Datawrapper’s API you will also need an API key, which you can obtain in your settings. DatawRappr can store that key for you on your machine, so you don’t have to specify it in every call to the API:
datawrapper_auth(api_key = "1234567")You can now create a new chart. If you add it to a variable (which is done with a <- in R) you can use that to make changes to that chart – without having to care about the chart ID (which you would otherwise need to tell Datawrapper which chart you want to edit):
my_chart <- dw_create_chart()You can then upload data to the chart, from within R:
dw_data_to_chart(my_dataframe_in_R, my_chart)If you want to change the headline or other parts of the chart:
dw_edit_chart(my_chart, title = "my new headline",
intro = "a updated intro", source_url = "https://www.datawrapper.de")
Then you might want to (re-)publish your chart:
dw_publish_chart(my_chart)These are the essential elements of the package, but there is also longer documentation available. Feel free to play around with it, and please have a look at the public source code on GitHub if you encounter any problems. I also write about projects I work on in R (sometimes also in Python) from time to time on the blog of my website.
Hi there, Lisa here. I hope you enjoyed Benedict’s guest post! If you’d like to write one yourself, get in touch with me at lisa@datawrapper.de. Like always, I’m looking forward to hearing from you.


Comments