

Watch the recordings of Unwrapped, our conference
August 12th, 2024
5 min
We’re excited to announce that Anna Lombardi will speak at our Unwrapped conference about how “Datawrapper was my life vest, both in a frantic national newsroom and in an EU research centre.“
Anna works as climate data visualizer at the Copernicus Climate Change Service, which informs politicians, policy makers, and the general public about the past, present, and future of our climate. She previously worked as a senior data and graphics journalist at The Times in London, specializing in visual journalism and finding stories in data. She holds a PhD in experimental physics from the University of Lyon (France) and a MSc in science communication from the International School for Advanced Studies in Trieste (Italy).
Time to ask her some questions:
How to respond to several daily requests for data visualisations in a fast-paced newsroom environment? How to quickly update your charts during a pandemic? How to convey complex scientific results in the most powerful, visually compelling way? Datawrapper has been my answer to all these questions over the past five and half years. Across very different work environments, this visualization tool has always come to the rescue in my daily job. Come find out how in my talk!
I first came across Datawrapper in 2016. I had just recently started a master’s in science communication at the International School for Advanced Studies in Trieste (Italy) and, during a data journalism class, our teacher presented a set of useful data visualization tools. Datawrapper was top of the list.
Two years later, I started working as a data and graphics journalist at the Times in London and I bumped into it again. As soon as I set foot in the newsroom I was given a full intro to Datawrapper and started using it on a daily basis from day one.
Over the following five years I produced over 3,200 charts and maps for both daily news stories and investigations, trying to get more and more creative along the way.
While at The Times, Datawrapper was used by our team for daily edition requests but also any time we needed to get a quick preview of the datasets we were working on. Having a custom design fitting the Times' style guide made it extremely easy for us to create several charts and maps a day in a uniform style, ready to be featured on our website or picked up for the print edition. When it comes to breaking news, the simplicity of this tool has allowed us to put together graphics and locator maps in literally no time... and time is always so precious in journalism!
Over the years we encouraged general reporters to experiment with visualizing their own data in Datawrapper and quite a few picked it up straight away.
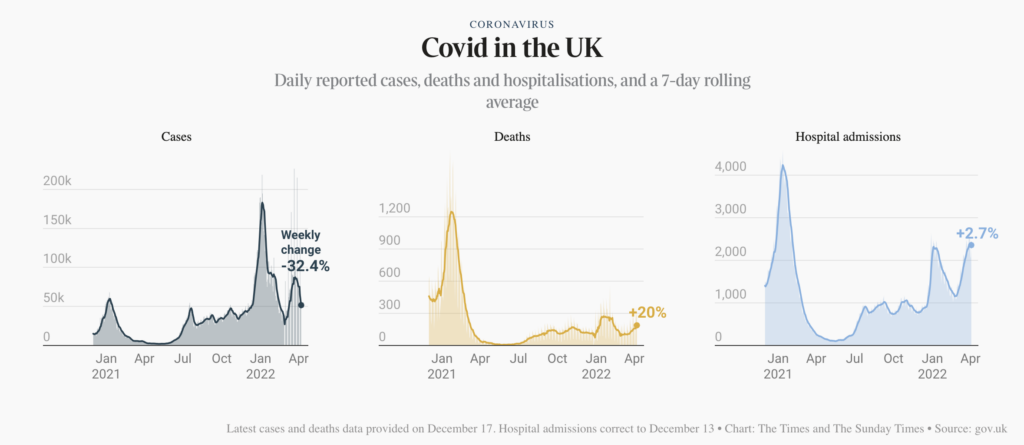
Datawrapper proved to be a crucial resource for us during COVID, when we decided to pull together a tracker page to follow the spread of the virus in the U.K. We put together a set of key graphics and used the DatawRappr package to keep them all updated daily. Since the pandemic, we've applied the same workflow to track political polls, strikes, migration figures, weather warnings, inflation, and so much more.
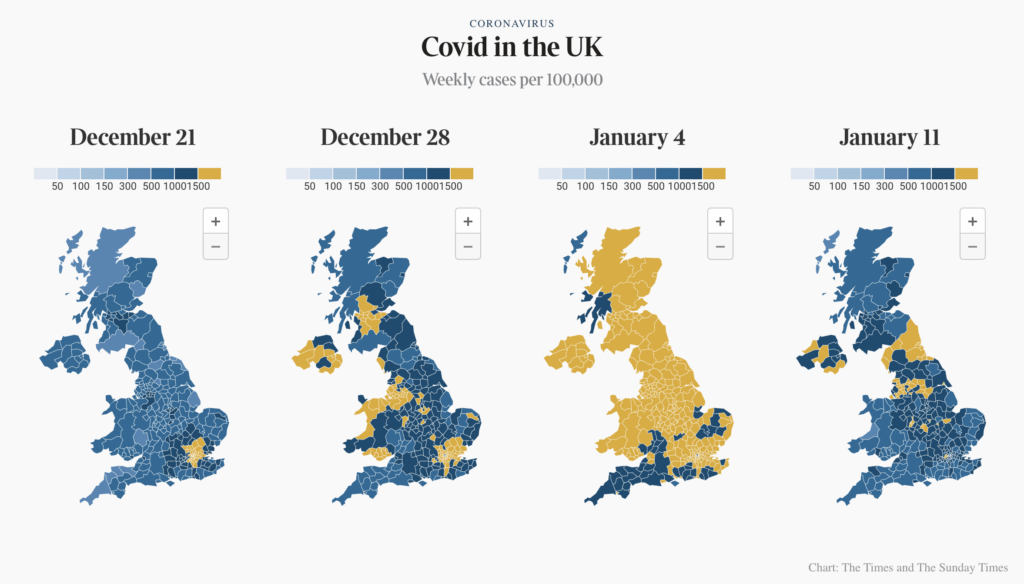
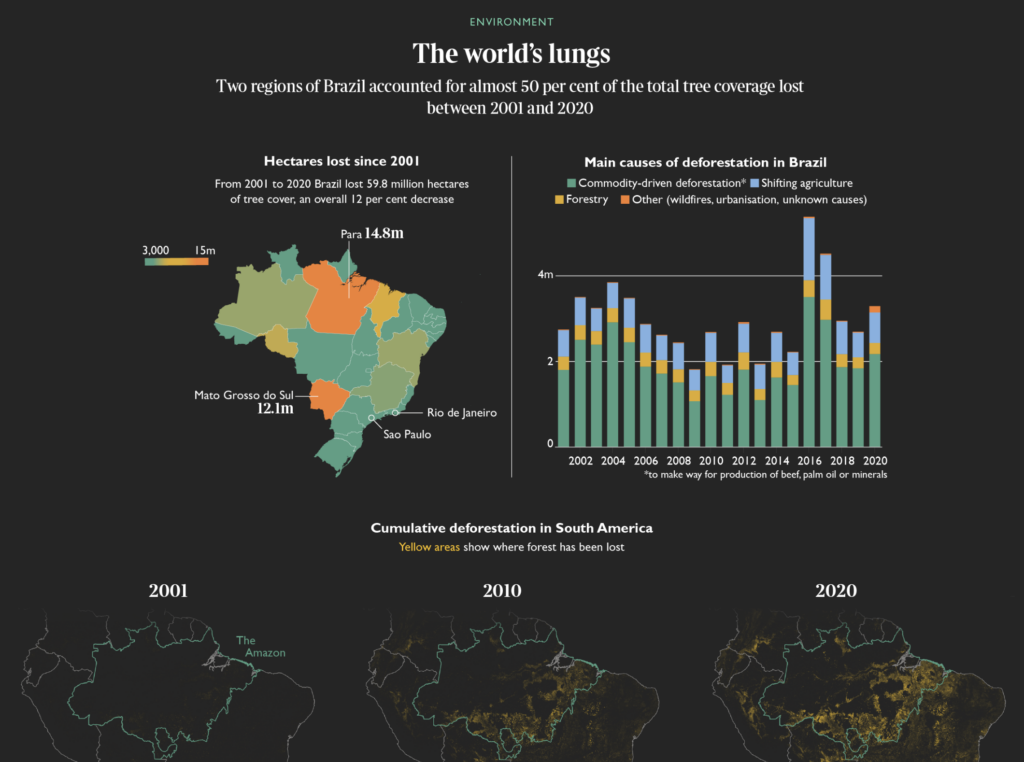
With time I have become more and more keen to experiment with nontraditional options, including homemade small multiples (like here or here) and combinations of charts and illustrations adapted in Illustrator.
Or searchable tables featuring icons and pictures:
After five years in the newsroom, last November I joined the Climate Intelligence team at Copernicus (ECMWF) as a climate data visualizer. The first thing I did was to set up a Datawrapper team account and showcase all the options this tool comes with.
Just one? Can I go with my top three?
When I create a graphic I aim at bringing together meaning, clarity, and beauty, asking myself many questions along the way: What’s the key message? Is it clear enough? Would an annotation or a better title make it even clearer? Is the chart a standalone object that can live outside the main article? Is there a better chart type I could try? Are colors readable? Is the graphic aesthetically pleasing? And, probably most important of all: Do I need a chart at all or would a paragraph of text be a better option?
We're looking forward to Anna's talk at Unwrapped! Until then, you can find her on X or LinkedIn. To sign up for Unwrapped and hear Anna and other great speakers, visit our conference website.


Comments