

New: Stay organized with a more powerful, faster visualization archive
June 25th, 2024
3 min
This article is brought to you by Datawrapper, a data visualization tool for creating charts, maps, and tables. Learn more.
We’re happy to introduce a better data upload for our choropleth maps. It’s faster, easier, more consistent with the chart editing workflow — and you can now connect your map to remote data with one click.
To try it out, go to app.datawrapper.de/create/map, select Choropleth map, choose a map, and proceed to Step 2: Add your data. You can also find a step-by-step guide in this Academy article.
Here’s what changed in detail:
We completely redesigned the structure of our map upload: You don’t need to click through multiple steps anymore. Instead, just upload the data with one click, and — if your data looks good — go straight to Step 3: Visualize to customize your map.
The map preview is also faster and better integrated with the page. Click on a region in the map to jump to the corresponding row of data, or select a row to see the corresponding region highlighted in the map. The map is too small to see anything? Simply enlarge the preview. (It’s useful for more than just Chile!)
There are now more ways to add your data to your choropleth map.
You can copy and paste your data into the little text field in the Upload tab. Or type the data into the table. Or upload a CSV or an Excel file. If you just want to try out a map, you can also fill our map with random data with one click.
Or, you can now connect to a Google Sheet or link your map to a CSV somewhere on the internet. Yes, you heard that right! So far, updating remote data (e.g. for live-updating map) was only possible with a complicated workaround. Now you’ll find the same options in the choropleth upload step that you’re used to from Step 1: Upload data when creating a chart.
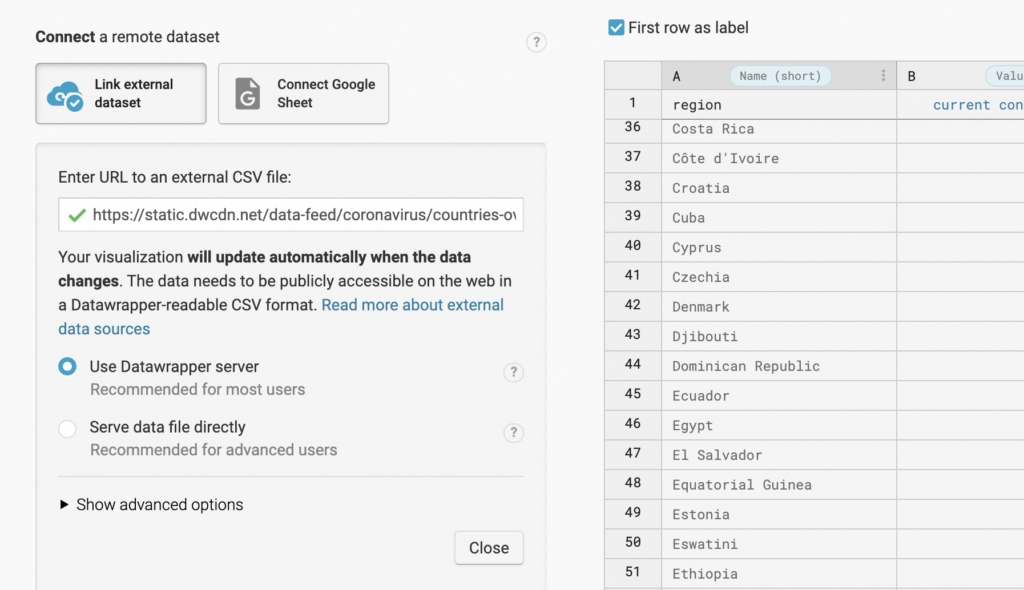
Learn more about how to create a live-updating choropleth map and how to connect your choropleth map to Google Sheets in our Academy.
Our more than 2500 basemaps all come with so-called “map keys” (like country names, ISO codes, ZIP codes, etc.) and your data should include some too. In the best case, they’re 100% identical. This way, Canada in your map actually shows the value you uploaded for Canada.
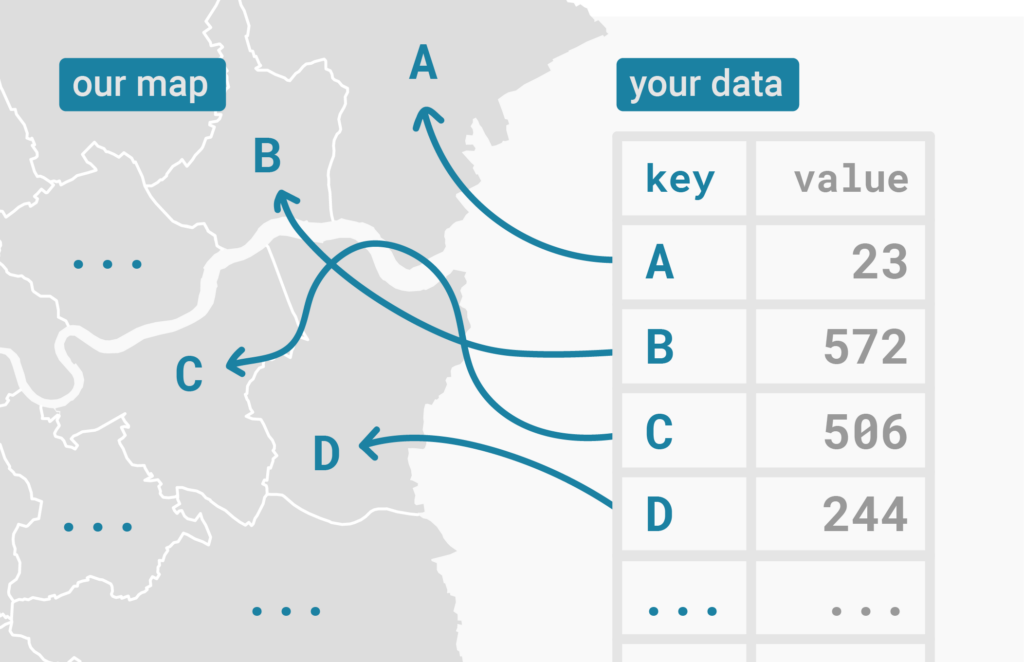
Datawrapper automatically detects the column with the best fit. Here’s an example: Our world map comes with different map key options that you can match in your data, like country names and ISO codes. If your data table comes with both country names and ISO codes, then Datawrapper will choose whichever of the two has the most matches.
And this automatic matching just got better. For example, if you upload a column with leading zeros (e.g. 00023) and our map key doesn’t have them (23), they will still match.
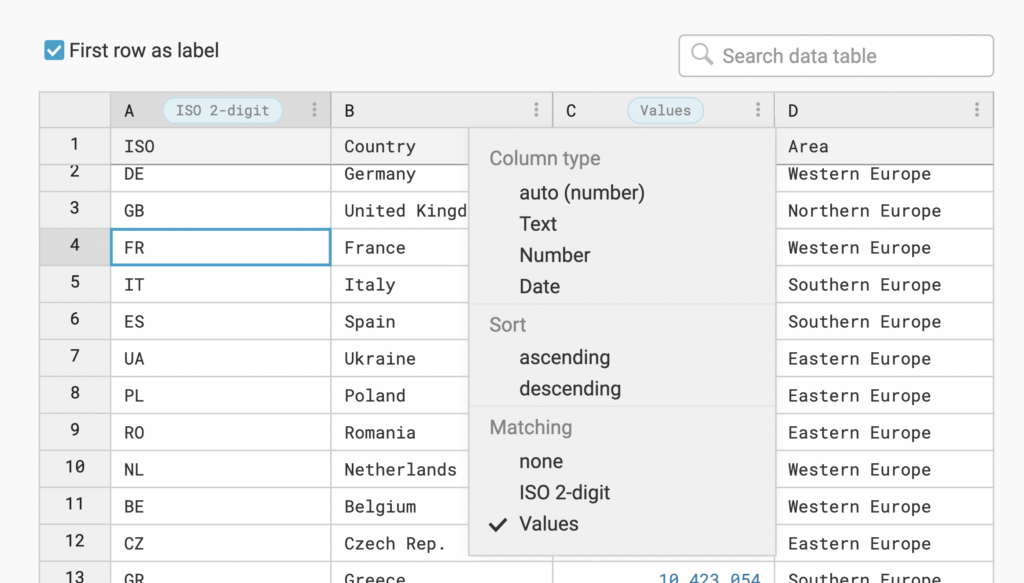
It’s also easier to see which of your columns got auto-detected to be the best fit for our map keys. We tell you directly in our column headers:

And in the few cases that Datawrapper didn’t select the correct map key, you can override it. Choose which column has the correct keys — and which kind of map key you want to match it with — in the Match tab:
But sometimes you upload map keys in which not all rows match. If your ISO code reads “UK” and ours reads “GB,” then it’s time to manually match the map keys. We also made this easier.
If you click on an unmatched row in your data (you’ll recognize it by its red color), you’ll see a drop-down menu with map keys that are still unmatched. Simply choose the right one:
The data upload in our choropleth maps now looks and behaves more similarly to the Step 2: Check & Describe you know from creating Datawrapper charts. That makes it easier to interact with the data you uploaded.
We at Datawrapper think a lot about the needs of data vis beginners, and how to help them succeed. So in our new data upload step, we still offer a structured process that helps you identify unmatched regions and other errors.
On the left side, you’ll find three tabs — Upload, Match, and Check — that you can go through by clicking Proceed. These three steps make sure that all your regions are showing the right data.
To get started creating choropleth maps with our new map data upload, visit our Academy article “How to create a choropleth map.” As always, let us know what you think about this update! We’re happy to hear from you at support@datawrapper.de, in the comments, or on Twitter (@datawrapper).
Comments