

New: Automatically label data points in line charts
September 18th, 2024
3 min
This article is brought to you by Datawrapper, a data visualization tool for creating charts, maps, and tables. Learn more.
We’re excited to introduce a completely redesigned data upload step for Datawrapper symbol maps. They’re now as fast and convenient as charts and choropleth maps, with no page reloading and the option to connect remote data in one click.
To try it out, go to app.datawrapper.de/create/map, select Symbol map, choose a basemap, and proceed to Step 2: Add your data. You can also find a step-by-step guide in this Academy article.
Here’s what’s changed in detail:
With this redesign, we’re bringing symbol maps in line with the workflow you’re used to from choropleth maps. That means you can upload data with one click, and — if everything looks good — go straight to Step 3: Visualize to start customizing your map.
And if you’ve noticed the chart editor running faster lately, you can now expect symbol maps to act the same. We’ve turned Datawrapper into a single-page application, which means no more wait for page reloads when switching between steps of the editor.
There are now more ways to add data to your symbol map. You can copy and paste into the text field in the Upload tab. Or search for individual places and addresses. Or upload a CSV or Excel file. Or type the data straight into our blank table.
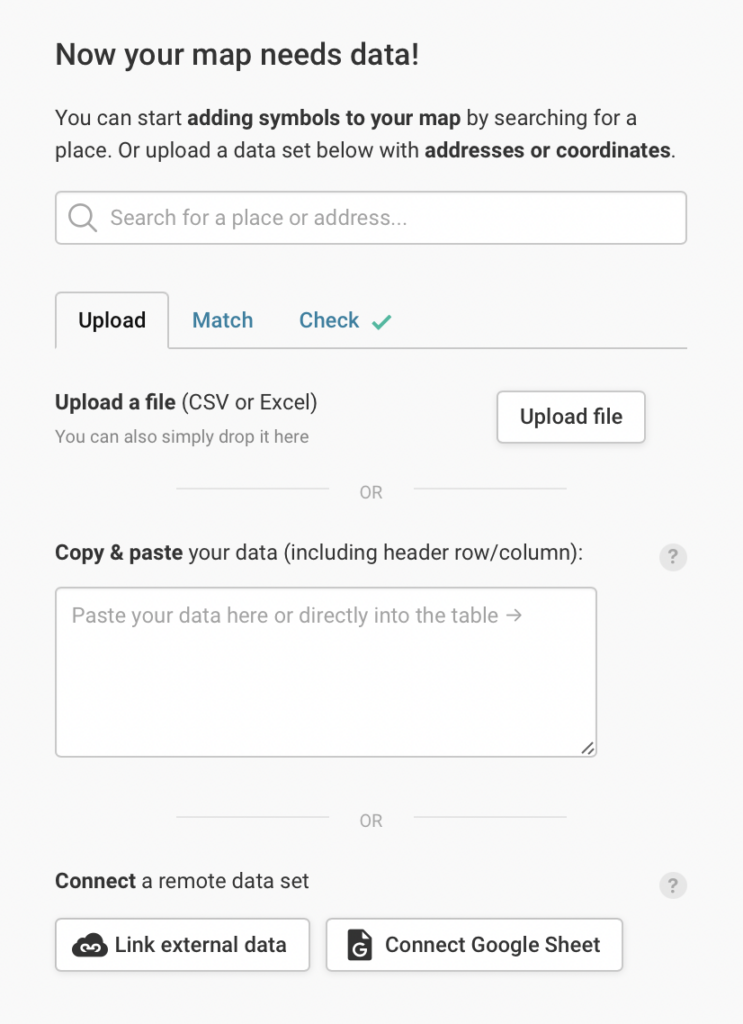
Or, you can connect to a Google Sheet or link your map to a CSV anywhere on the internet. Yes, it’s here! Up to now, linking remote data (e.g., for a live-updating election map) was only possible through a complicated workaround. Now everyone can do it in a few clicks.
Learn more about how to create a live-updating symbol map in our Academy.
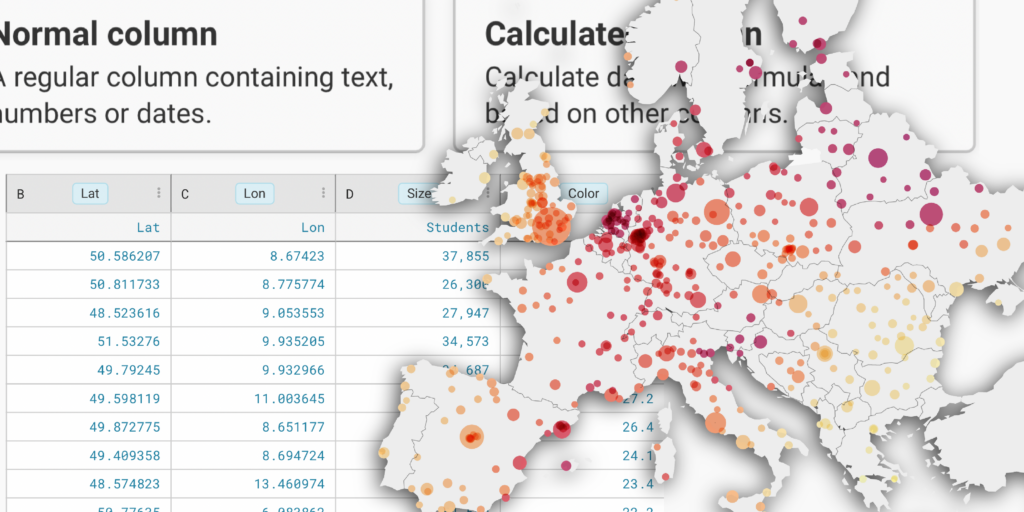
Once your data is uploaded, it will now look and behave similarly to the data tables you’re used to in choropleth maps. That means it just got way easier to interact with and edit your symbol map data directly in Step 2.
Step 2 isn’t just about about uploading — it’s now easier to get a head start on designing your map as well.
There’s a lot to consider in this new upload step, which is why we offer a structured process to help you identify missing or misplaced data and other errors.
On the left side, you’ll find three tabs — Upload, Match, and Check — and a Proceed button to take you through them. By going through these tabs in order, you can be sure your map ends up in perfect shape.
To get started creating symbol maps with our new data upload step, visit our Academy article “How to create a symbol map.” As always, let us know what you think about this update! We’re eager to hear from you in the comments, at support@datawrapper.de, or on Twitter (@Datawrapper).


Comments