

Read “Practical Charts” by Nick Desbarats with us!
October 14th, 2024
7 min
This article is brought to you by Datawrapper, a data visualization tool for creating charts, maps, and tables. Learn more.
″…one of the most important things I can show people is the incredibly wide array of graphs available to them.”
Edit April 20: Because of problems with the distribution of Jon’s book in Europe, we’re moving the discussion date to May 18, 2021.
Do you keep getting recommendations for data vis books, maybe even buy them, but don’t make it a priority to read them? Let’s read these books together – and let’s discuss them, to get more out of them. That’s what the Data Vis Book Club is about. Join us! Here’s what we’ll read next.
After discussing four chapters from “Data Visualization in Society” last week, I’m happy to already announce the next book for our little book club: Jon Schwabish’s new book “Better Data Visualizations: A Guide for Scholars, Researchers, and Wonks”, fresh from the printer!
We will discuss Better Data Visualizationson Wednesday, 28th of April
on Tuesday, 18th of May, at 5pm UTC here:
notes.datawrapper.de/p/bookclub-jon-schwabish
That’s 10am on the US west coast, 12pm in Chicago, Colombia, and Peru, 1pm on the US east coast, 2pm in Brazil and Argentina, 6pm for readers in the UK & Portugal, 7pm for most other Europeans and 10.30pm in India.
Jon Schwabish will join us around 45min into the discussion to answer all our questions.
Like always, everyone is welcome to join! Just open the notepad at the correct date and time and start typing. Many participants will be new to the conversation – we’ll figure it out as we go.
The people have spoken! This time, I tried something new: I asked people who follow @datavisclub on Twitter to participate in a mini-survey on Google Forms. 32 people participated. Here are the results:
Looks like you all are excited to read Jon’s new book – so let’s do exactly that.
Jon Schwabish is an economist by training who decided that communication is important – and has written two books on the topic. “Better Data Visualizations” is his third, and it’s no surprise it finally focuses on how to visualize data well: Jon has been super duper active in the data vis community. He’s a data vis blogger and tweeter, hosts a data vis podcast and – his latest project – lets people explain chart types on his YouTube channel.
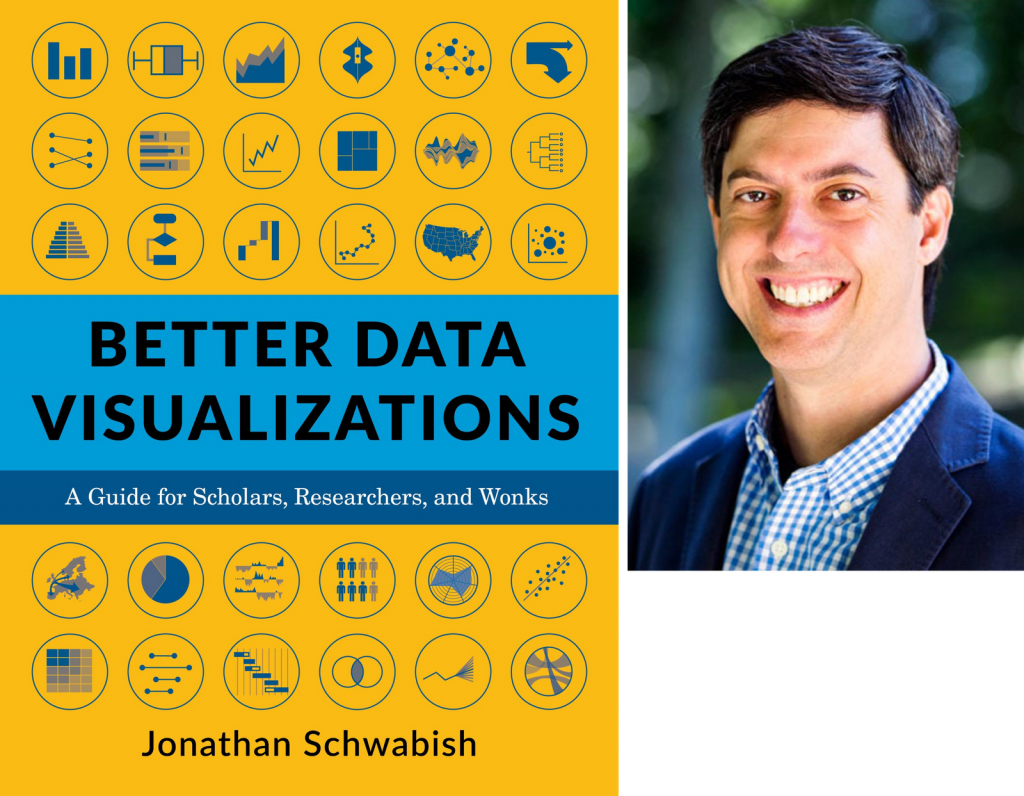
“Better data visualization,” now, focuses on precisely that: chart types. Jon goes through general data vis principles in the beginning and tips on creating a data vis style guide in the end. But the big chunk – 280 of the 400 pages – are about do’s and don’ts for more than 80 (!) specific chart types: bar chart, cycle chart, cartogram, pyramid chart, treemap; you name it. “I discovered that one of the most important things I can show people is the incredibly wide array of graphs available to them,” Jon writes in his introduction.
You can find the whole index in Jon’s explanation of the book’s structure.
If you want practical data vis advice for specific chart types, this book is for you. What are the advantages and disadvantages of each chart type? When should you use them? And how? Jon will tell you. (Jon won’t tell you much about the tools you can use to create these different chart types.)
1. You get the “Better Data Visualizations” book. Ask your local library to order it for you, buy it, borrow it from a friend, ask around on your preferred social network.
2. We all read the book. That’s where the fun begins! Please mention @datavisclub or use the hashtag #datavisclub if you want to share your process, insights, and surprises – I’ll make sure to tweet them out as @datavisclub as motivation for us all.
3. We get together to talk about the book. This will happen digitally on Wednesday, 28th of April at 5pm UTC over at notes.datawrapper.de/p/bookclub-jon-schwabish.
It won’t be a call or a video chat; we’ll just write down our thoughts. The discussion will be structured into three questions:
During the conversation, I’ll ask these three questions in the following order:
1 What was your general impression of the book? Would you recommend it? To whom?
2 What was most inspiring, insightful or surprising while you worked through the book? What did you learn that you didn’t expect to?
3 Having read the book, what will you do differently the next time you visualize data?
For each question, you can prepare an answer in 1-2 sentences and paste it into the notes once I ask the question during the conversation. If you can’t find the time to prepare anything at all just come by and chat – we’ll quickly get into discussion mode.
After going through the three questions within ca 45min, Jon will join us to answer questions we might have about the book.
Here’s a short FAQ for you, in case you have more questions:
A digital book club is a new experience for many of us. See how our book club discussions have looked like in the past:

You can also read the review of the first book club, to learn how people found the experience.
This is what others have said about some of the last book club discussions:
Because it works well for introverts and for people who prefer to stay anonymous in the discussion. Plus, native English speakers have less of an advantage than they have in calls. Plus, the documentation of our meeting writes itself.
Do you have a lunch date? Vacation? Need to bring the kids to bed? Need to sleep yourself? No problem! The conversation will be archived in the notes and can still be extended over the next day(s).
You can either subscribe to our Datawrapper Blog Update newsletter, turn on notifications for our Twitter account or leave your Twitter handle in a list. I explain all three options in more detail here.
I’m very, very much looking forward to working through the chapters of “Better Data Visualizations” with all of you. If you have any more questions, write in the comments, at lisa@datawrapper.de or to Lisa / Datawrapper on Twitter. Also, make sure to follow @datavisclub, to stay up-to-date and get a dose of motivation from time to time.


Comments