

Read “Practical Charts” by Nick Desbarats with us!
October 14th, 2024
7 min
This article is brought to you by Datawrapper, a data visualization tool for creating charts, maps, and tables. Learn more.
“…a celebration of the technical and personal growth we’ve gone through…”

Do you keep getting recommendations for data vis books, maybe even buying them, but then don’t make it a priority to read them? Let’s get more out of these books by reading and discussing them together. That’s what the Data Vis Book Club is for. Here’s what we’ll read next — join us!
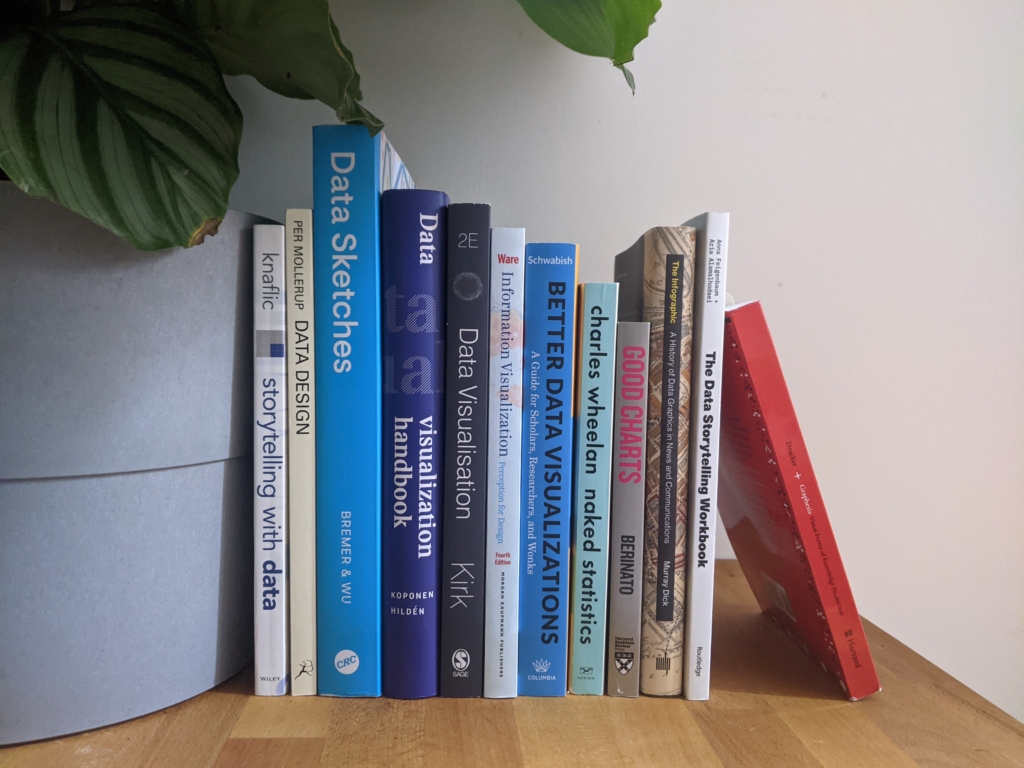
After discussing Jon Schwabish’s “Better Data Visualizations” two weeks ago, I’m happy to announce the next book for our little book club: Nadieh Bremer and Shirley Wu’s still fairly new “Data Sketches”!
We will discuss Data Sketches on here: notes.datawrapper.de/p/bookclub-datasketches
That’s 10 a.m. on the U.S. west coast; 12 p.m. in Chicago, Colombia, and Peru; 1 p.m. on the U.S. east coast; 2 p.m. in Brazil and Argentina; 6 p.m. for readers in the U.K. and Portugal; 7 p.m. for most other Europeans; and 10:30 p.m. in India.
Both Nadieh and Shirley will join us around 45 minutes into the discussion to answer all our questions.
Like always, everyone is welcome to join! Just open the notepad at the correct date and time and start typing. Many participants will be new to the conversation — we’ll figure it out as we go.
Nadieh Bremer (@NadiehBremer, visualcinnamon.com) and Shirley Wu (@sxywu, shirleywu.studio) are freelance data visualization designers from opposite sides of the world: Nadieh lives in Amsterdam, Shirley in San Francisco. In 2016 they met in the middle, at the OpenVis Conf in Boston — and a few months later, decided to collaborate. Data Sketches was born: They decided to cover 12 topics in 12 projects over 12 months. And when they put it online, people loved it! (Here’s what datasketch.es looked like in 2017.)
This year, their 24 projects finally came out as a big, heavy book: “a beautiful coffee table book with large, indulgent images of our projects, side-by-side with our very technical process write-ups,” as they put it in the foreword.
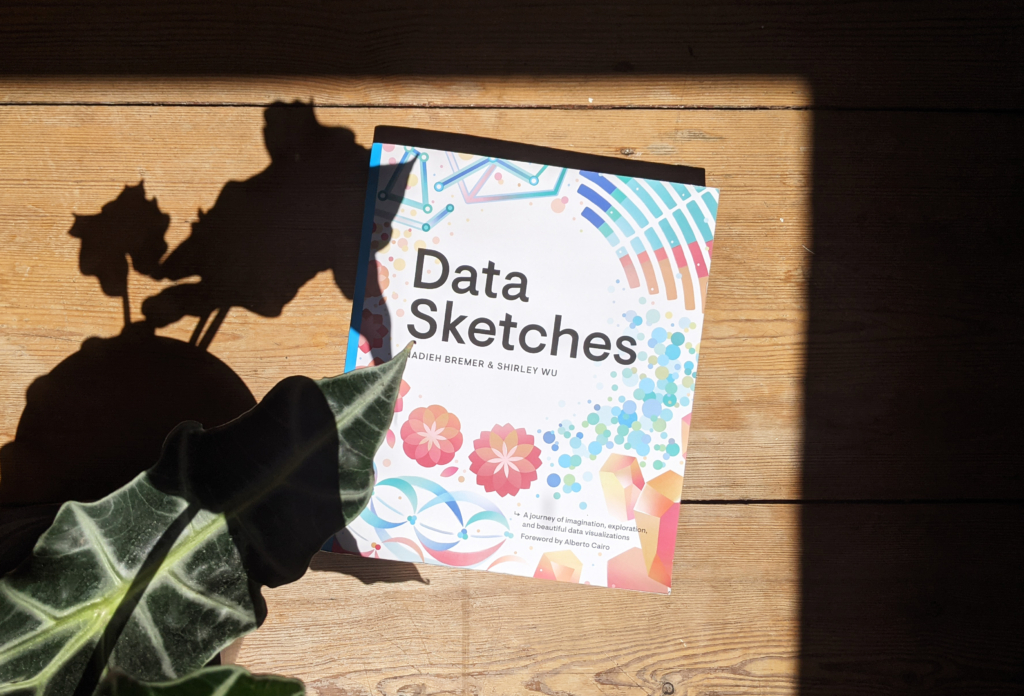
And that’s exactly what it is. The book comes with big images of sketches, drafts, and their final projects — but also with explanations of how to check data accuracy, when to use trigonometry in data vis, how scrollytelling works, or the difference between SVG and Canvas.
Nadieh and Shirley both used mostly D3.js to create their visualizations. But it’s less a book about code and more an honest look at the data vis process: how to form an idea, how to get data, how to be limited by tools, and how to work around those limits. We can watch Nadieh and Shirley make decisions and go down different paths. We can watch them failing and learning, and we can watch them always arriving at a beautiful visualization at the end. There’s no other book out there that looks at the process of coming up with elaborate, nonstandard (“eccentric,” as Alberto Cairo calls them in his foreword) visualizations in such detail.
If you want a list of data vis rules or a guide on how to build a bar chart in D3.js, this book is not for you. If you learn by watching others, then it will be a treasure trove.
1. You get “Data Sketches.” Ask your local library to order it for you, buy it, borrow it from a friend, ask around on your preferred social network. You can find a sample chapter and some of the other write-ups on datasketch.es, too.
2. We all read the book. This is where the fun begins! Please mention @datavisclub or use the hashtag #datavisclub if you want to share your process, insights, and surprises — I’ll make sure to tweet them out from @datavisclub as motivation for us all. Don’t worry if you don’t read every word on all >420 pages of the book! Start by reading the projects that appeal the most to you and see how far you get.
3. We get together to talk about the book. This will happen digitally on Tuesday, August 3, at 5 p.m. UTC over at notes.datawrapper.de/p/bookclub-datasketches.
It won’t be a call or a video chat; we’ll just write down our thoughts. The discussion will be structured into three questions:
During the conversation, I’ll ask these three questions in the following order:
1 What was your general impression of the book? Would you recommend it? To whom?
2 What was most inspiring, insightful, or surprising? What did you learn that you didn’t expect to?
3 Having read the book, what will you do differently the next time you visualize data?
For each question, you can prepare an answer in 1-2 sentences and paste it into the notes once I ask the question during the conversation. If you can’t find the time to prepare anything at all just come by and chat – we’ll quickly get into discussion mode.
After discussing these three questions for about 45 minutes, Nadieh and Shirley will join us to answer questions we might have about their book.
Here’s a short FAQ for you, in case you have more questions:
A digital book club is a new experience for many of us. See what our book club discussions have looked like in the past:

You can also read the review of the first book club, to learn how people found the experience.
This is what others have said about some of the last book club discussions:
Because it works well for introverts and for people who prefer to stay anonymous in the discussion. Plus, native English speakers have less of an advantage than they have in calls. Plus, the documentation of our meeting writes itself.
Do you have a lunch date? Vacation? Need to put the kids to bed? Need to sleep yourself? No problem! The conversation will be archived in the notes and can still be extended over the next day(s).
You can either subscribe to our Datawrapper Blog Update newsletter, turn on notifications for our Twitter account, or leave your Twitter handle in a list. I explain all three options in more detail here.
I’m very, very much looking forward to working through the chapters of “Data Sketches” with all of you. If you have any more questions, write them in the comments or send them to lisa@datawrapper.de or to Lisa / Datawrapper on Twitter. Also, make sure to follow @datavisclub to stay up-to-date and get a dose of motivation from time to time.


Comments