We want to enable everyone to create beautiful charts, maps, and tables. New to data visualization? Or do you have specific questions about us? You'll find all the answers here.
The best of last week’s big and small data visualizations
Rose Mintzer-Sweeney
Lisa Charlotte Muth
Welcome back to the 11th edition of Data Vis Dispatch! Every week, we’ll be publishing a collection of the best small and large data visualizations we find, especially from news organizations — to celebrate data journalism, data visualization, simple charts, elaborate maps, and their creators.
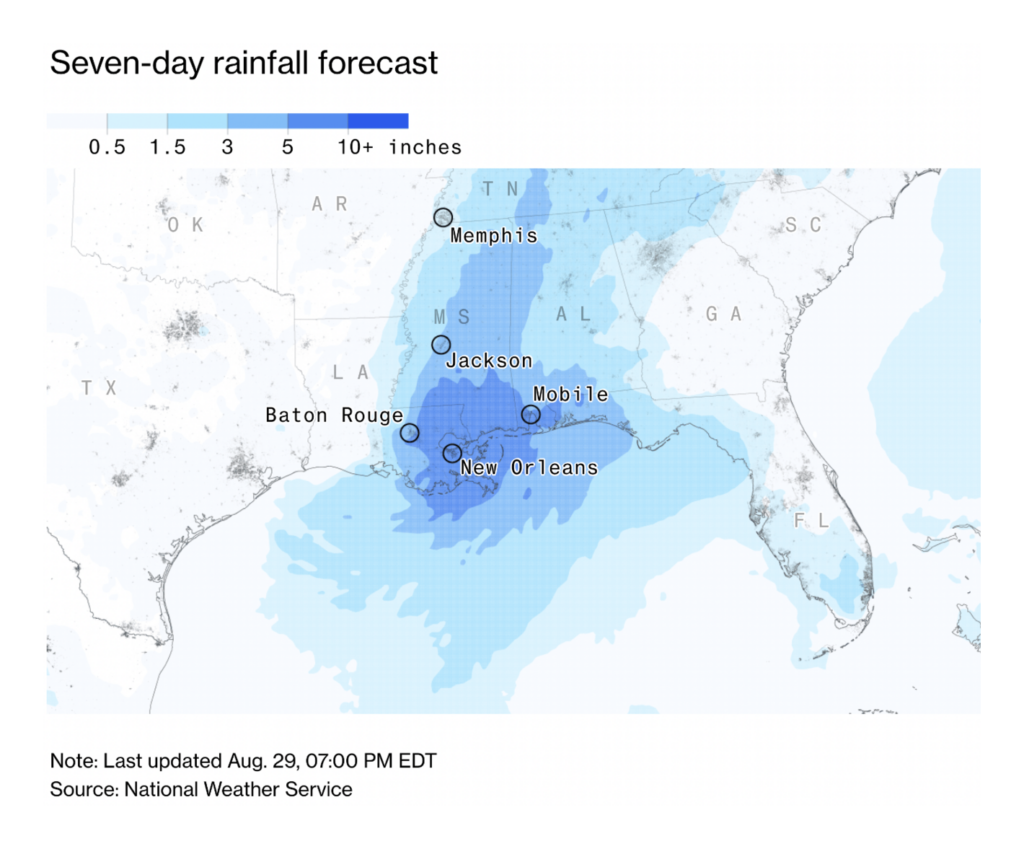
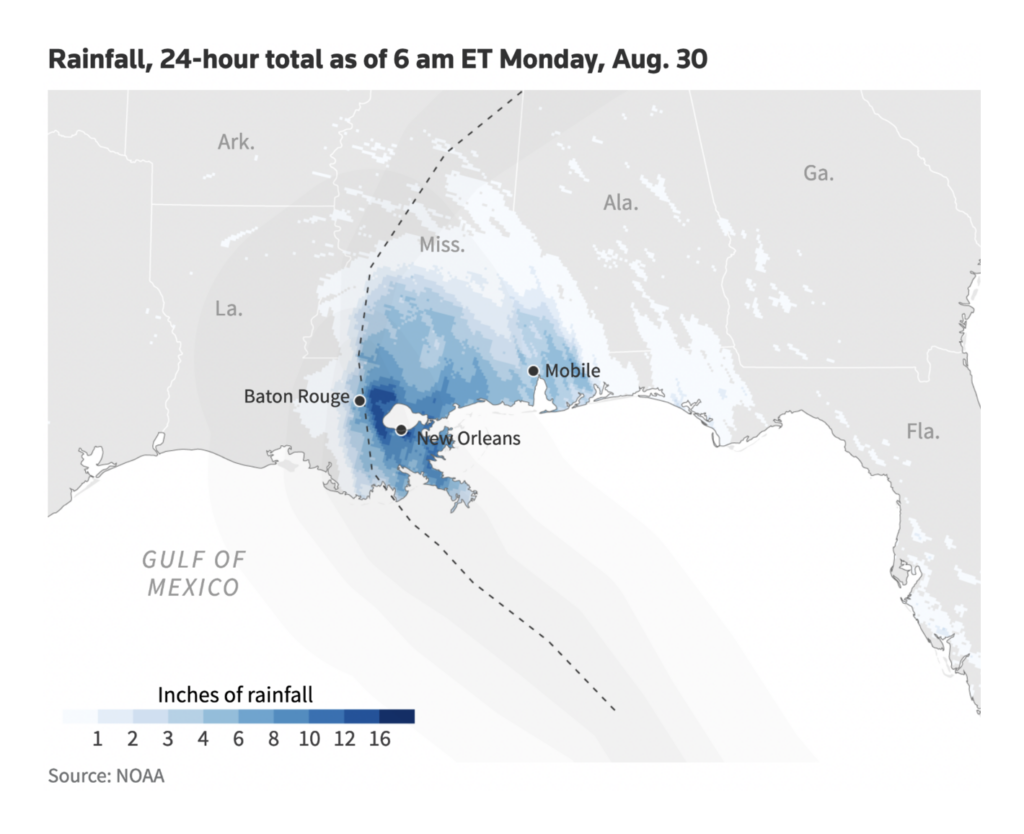
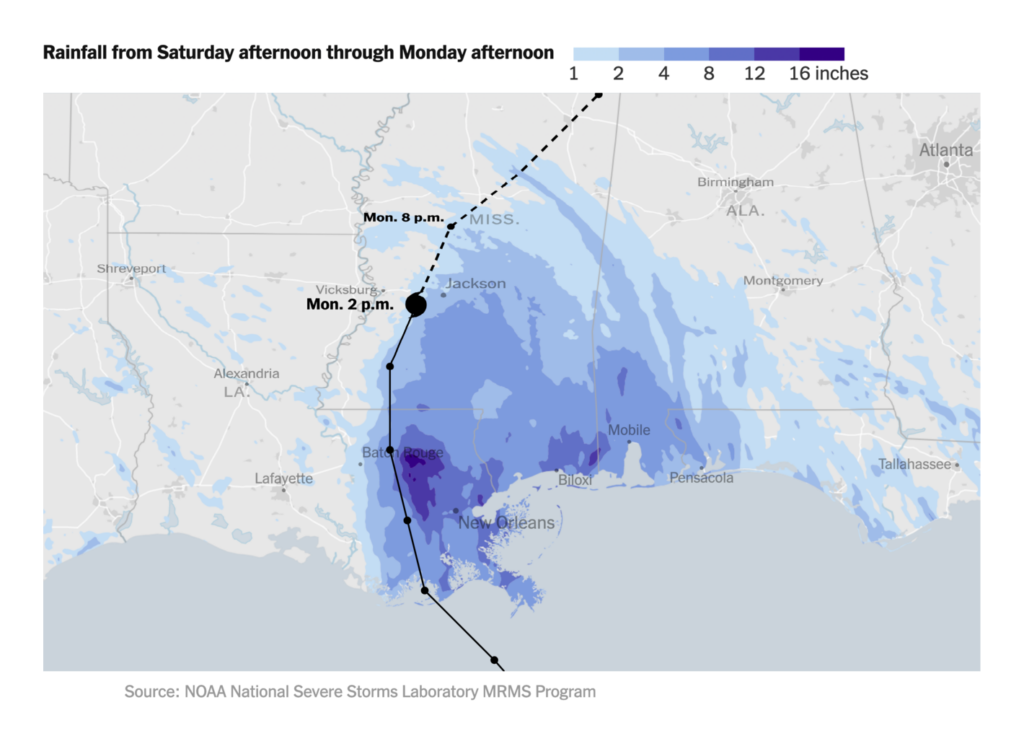
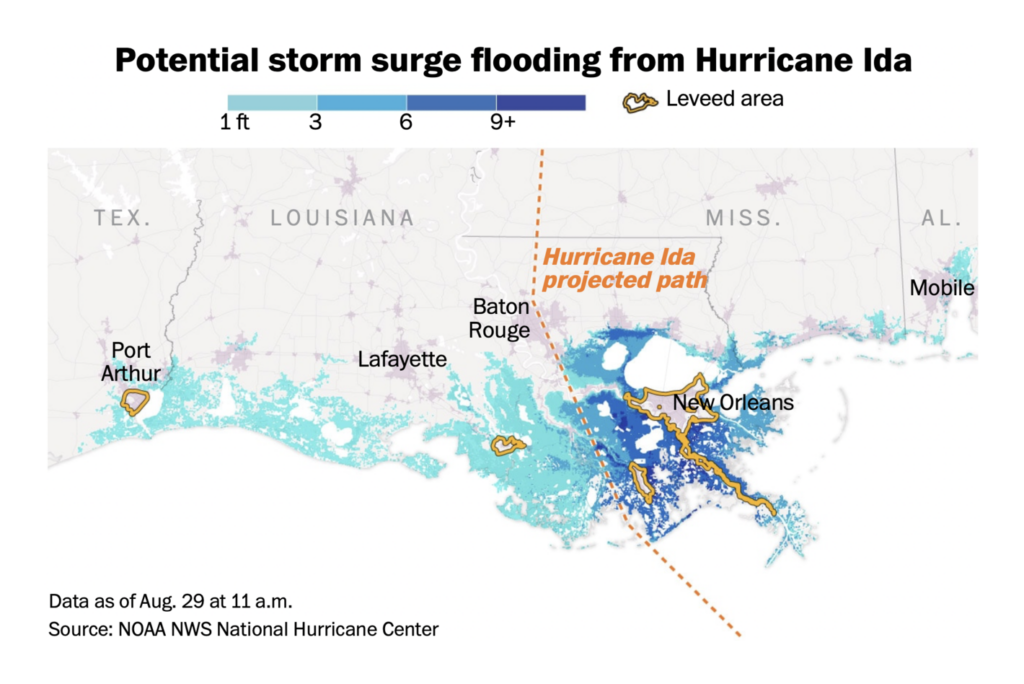
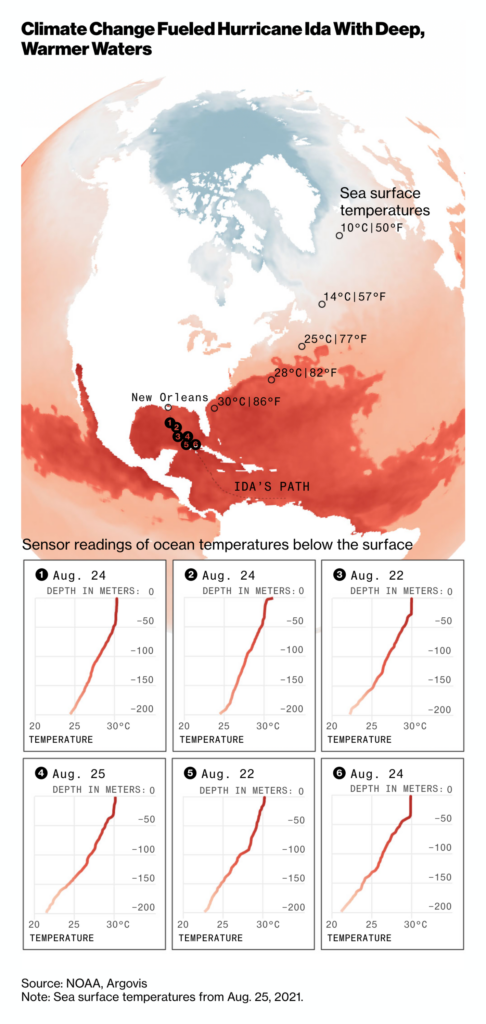
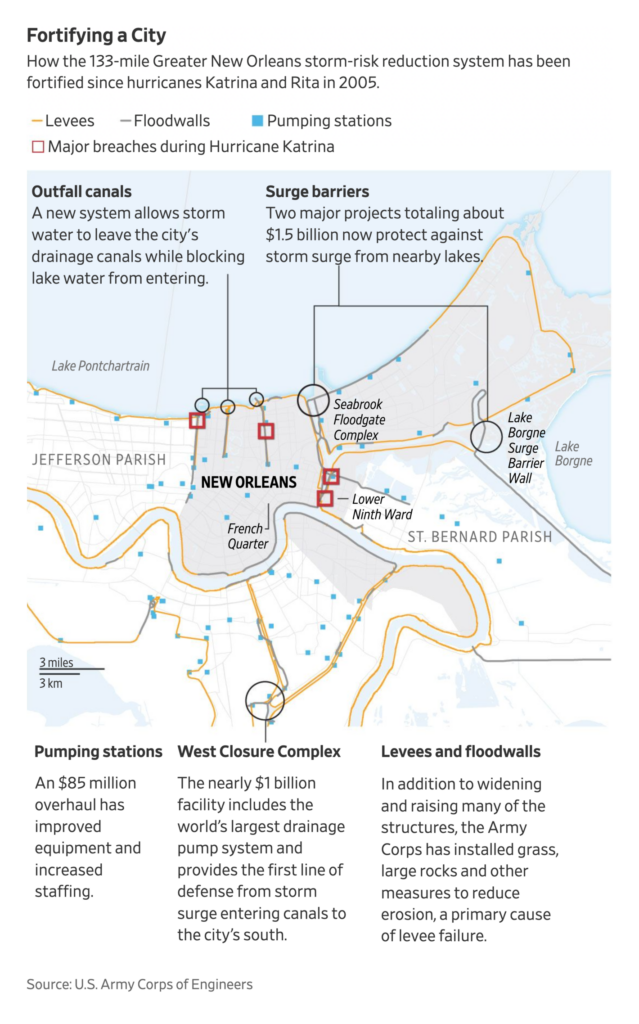
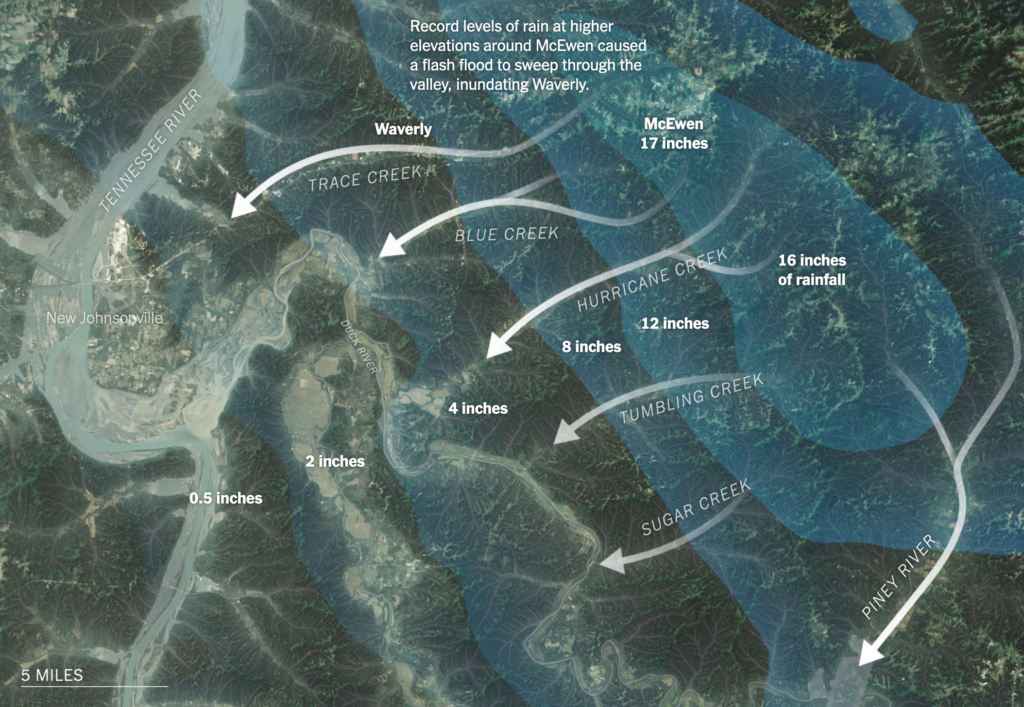
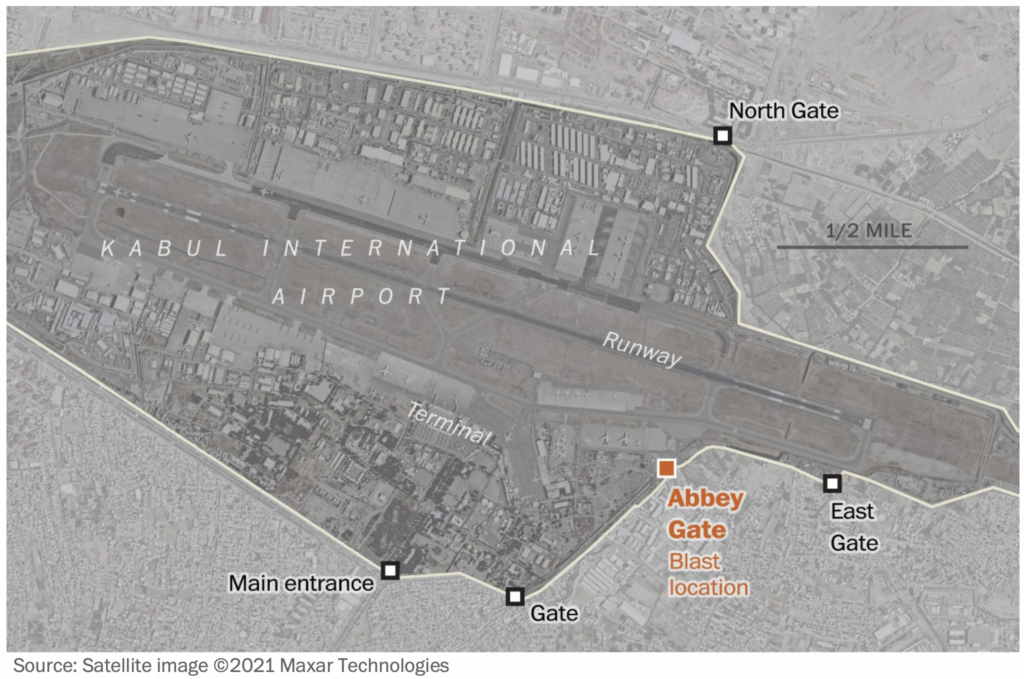
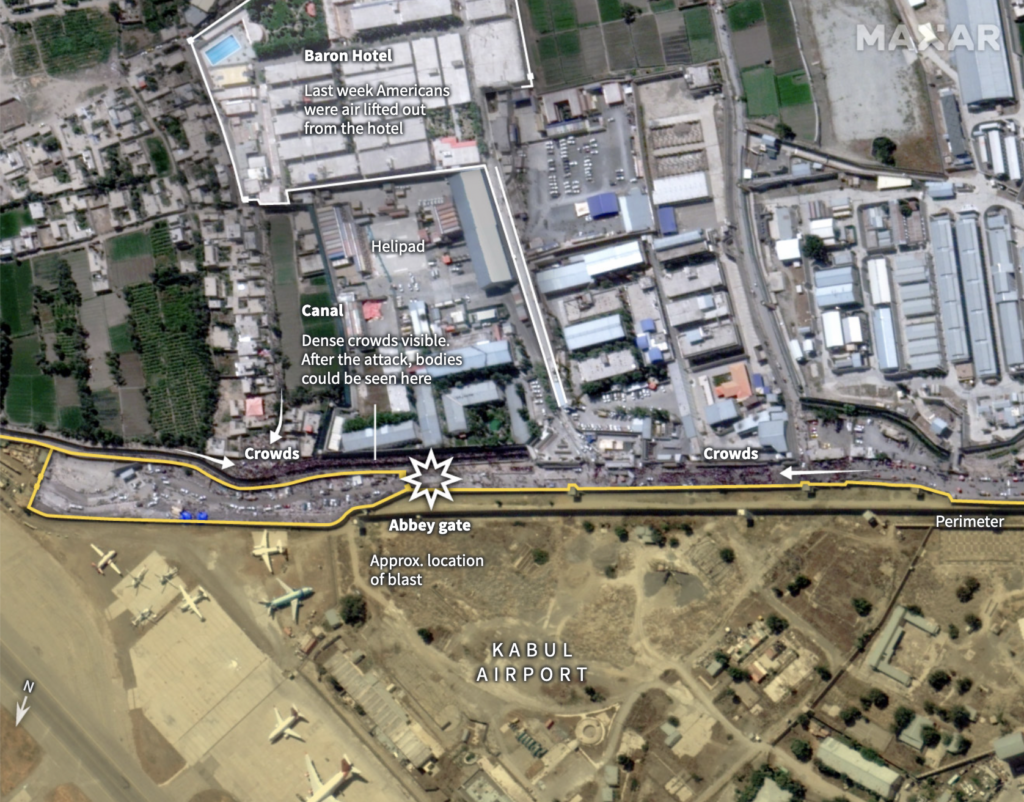
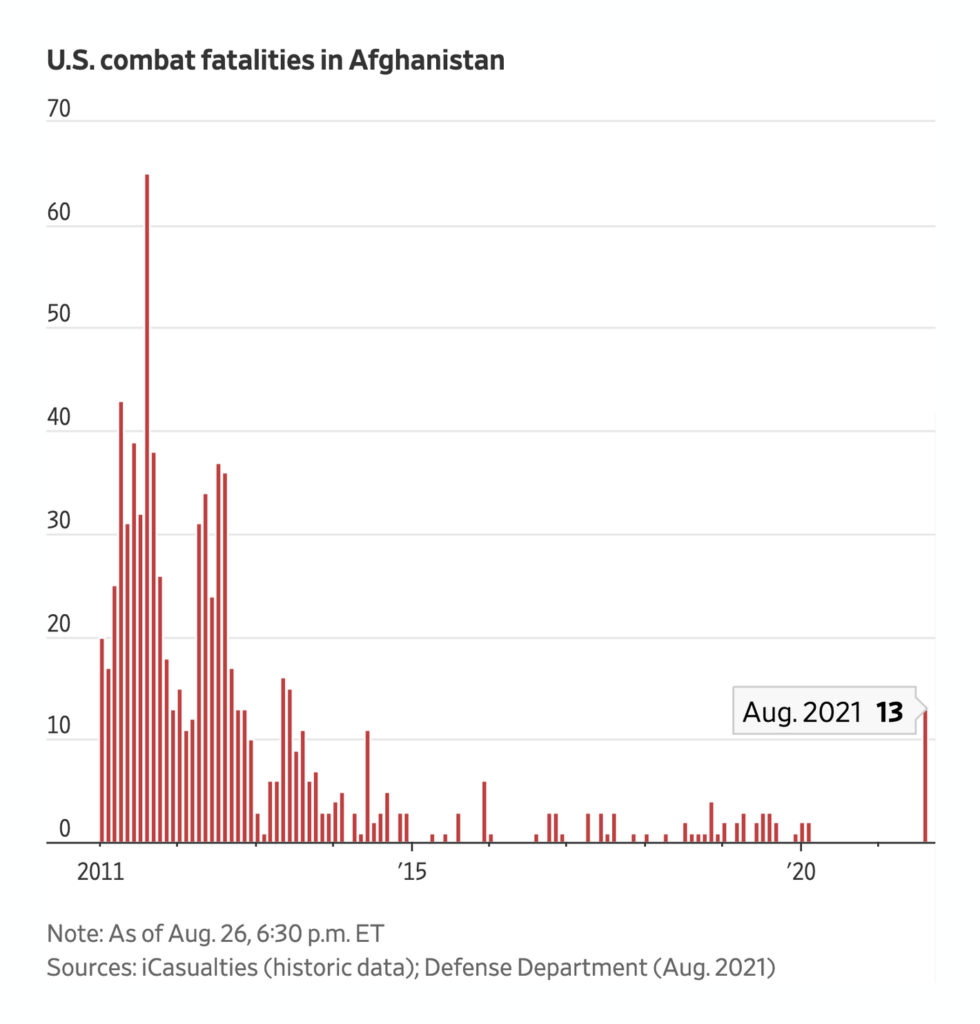
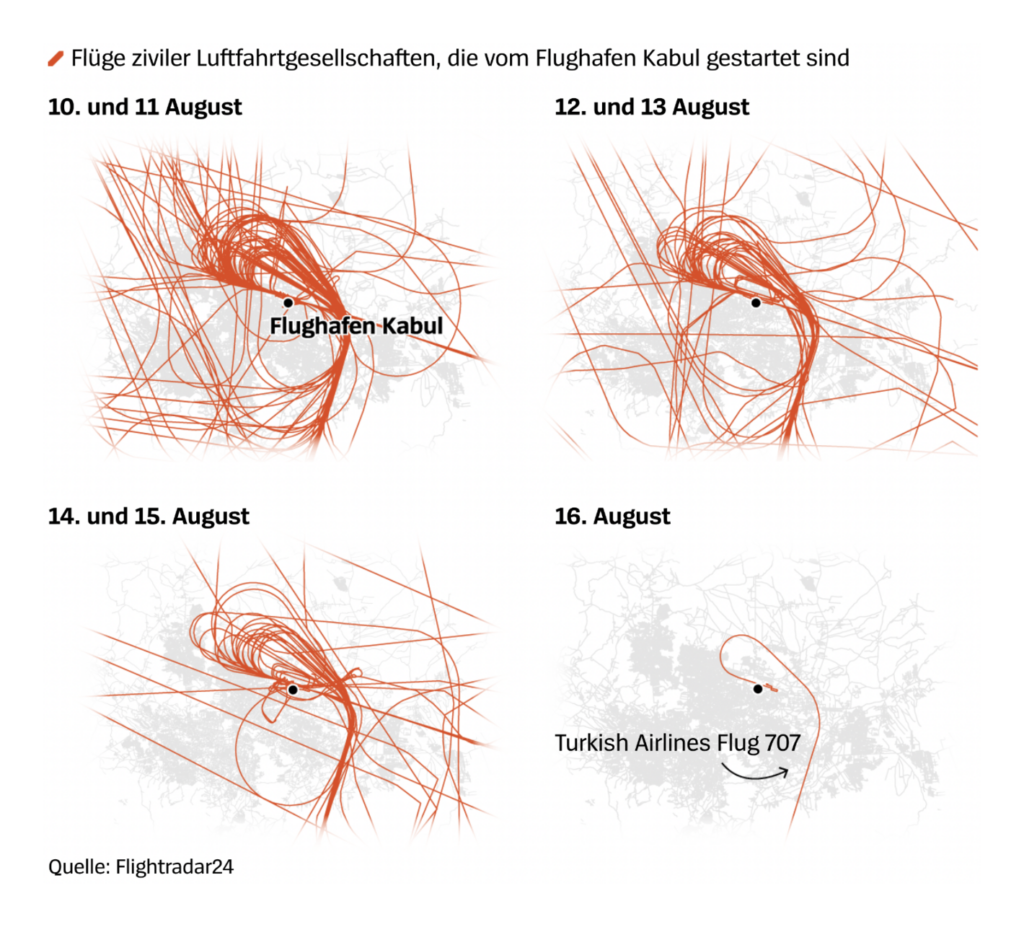
Recurring topics this week include the last days of America’s war in Afghanistan, the arrival of Hurricane Ida at the coast of Louisiana, Mississippi, and Alabama in the U.S., and yes, yet again, the rise of COVID-19 cases.
First, Hurricane Ida, which pummeled the Gulf Coast. Many newsrooms offered trackers:
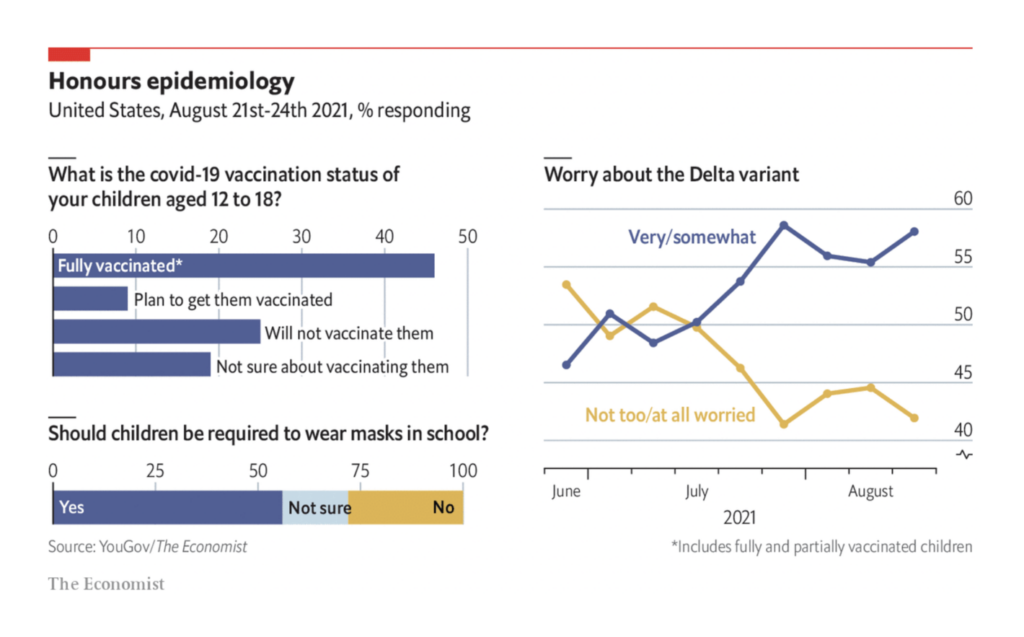
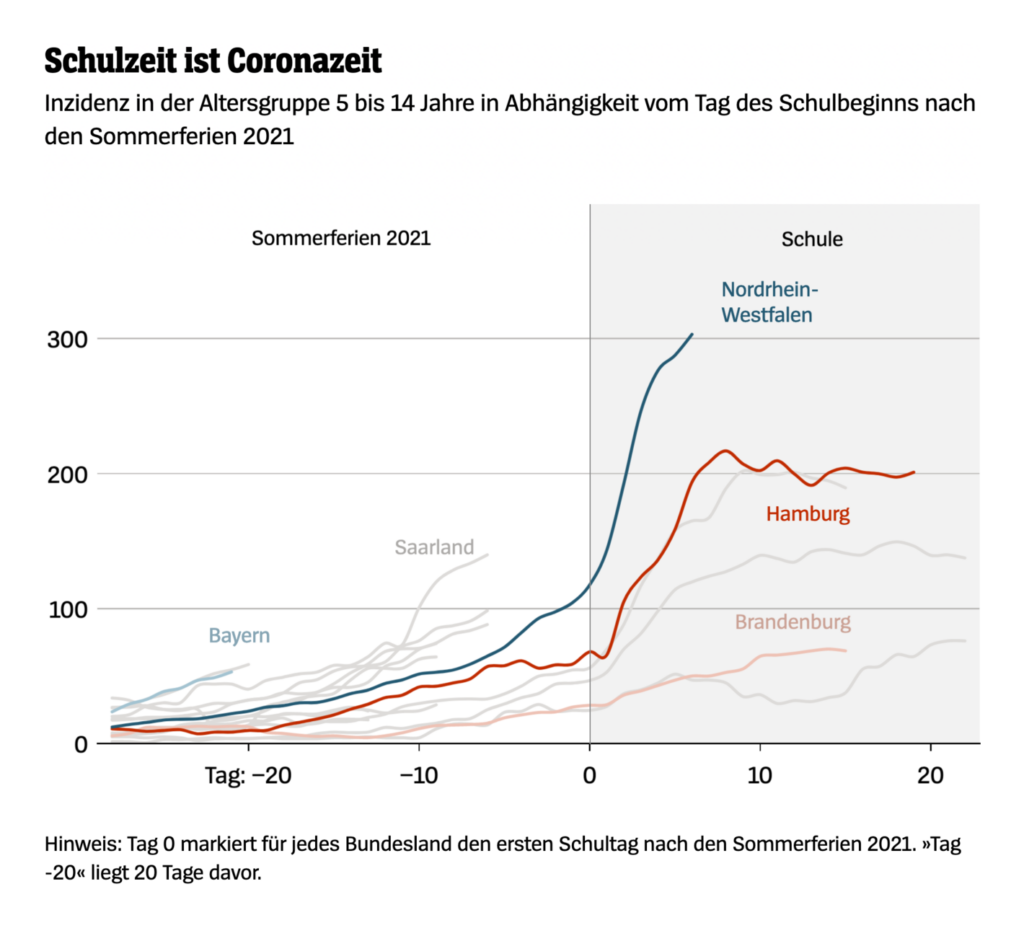
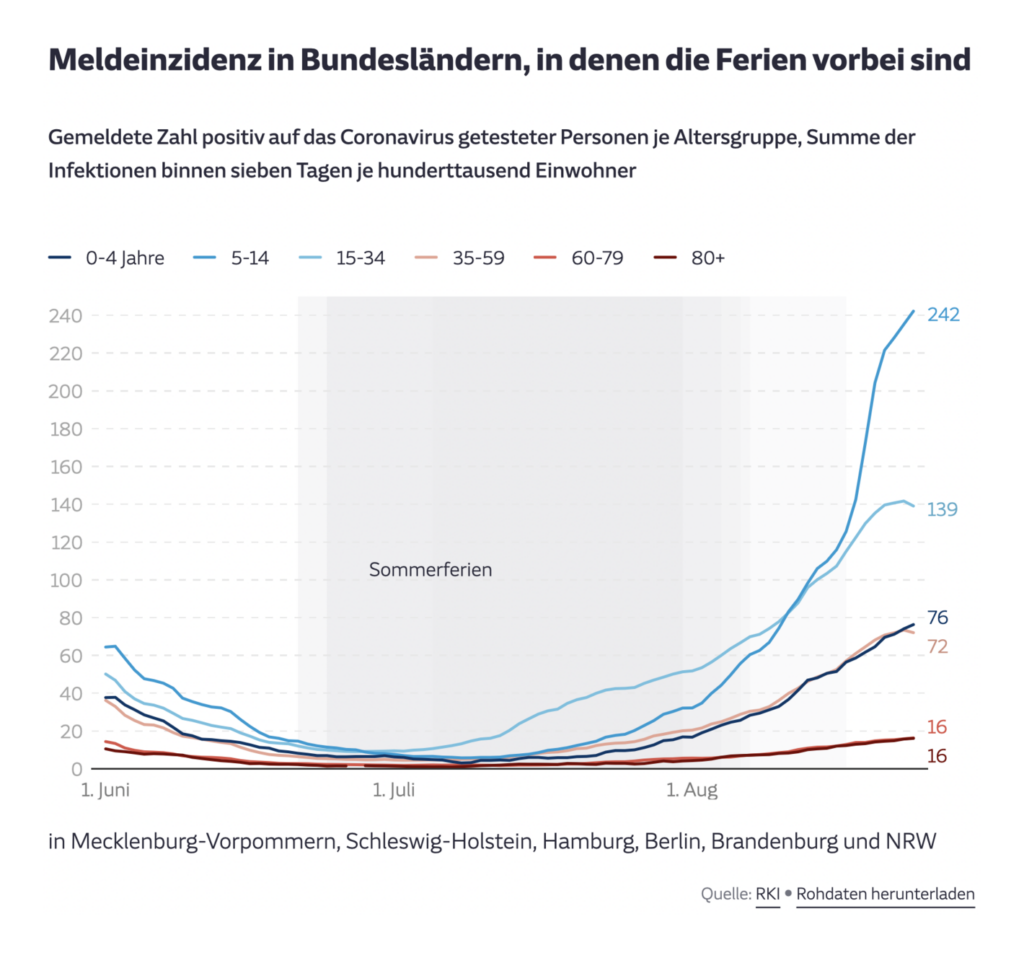
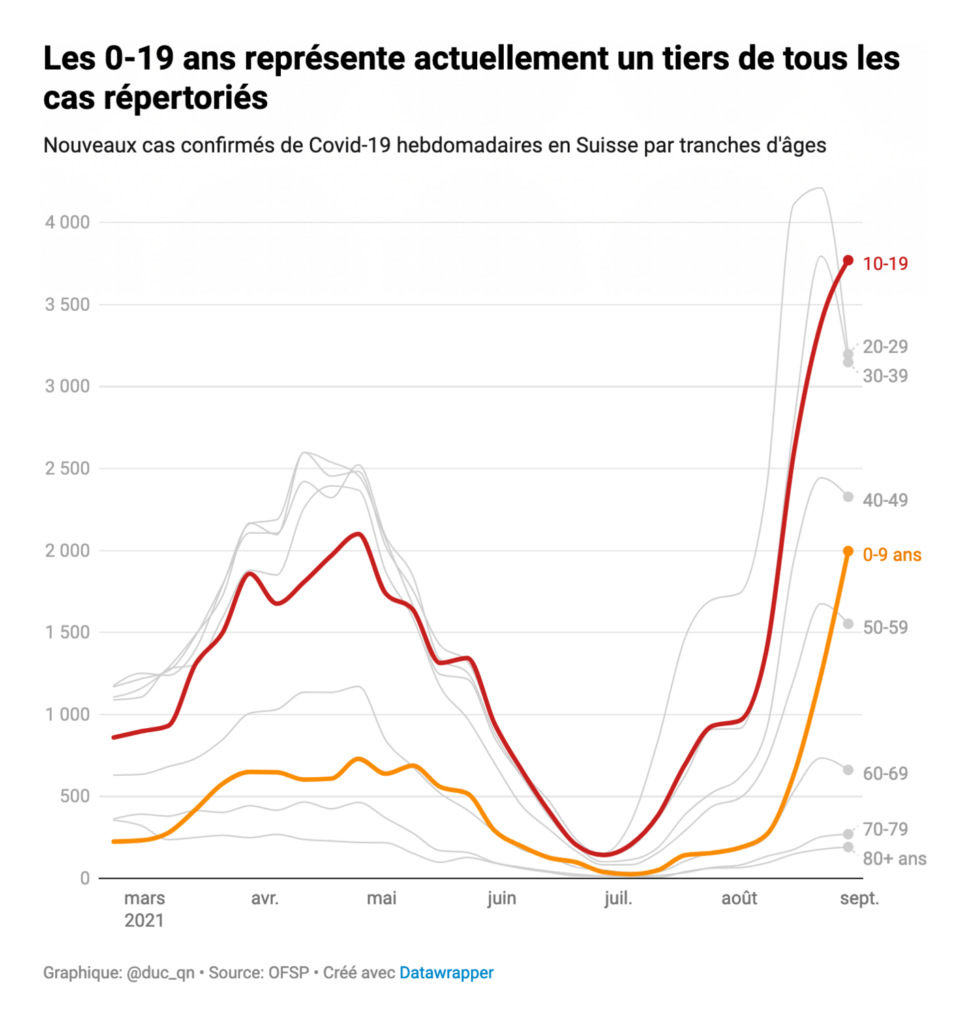
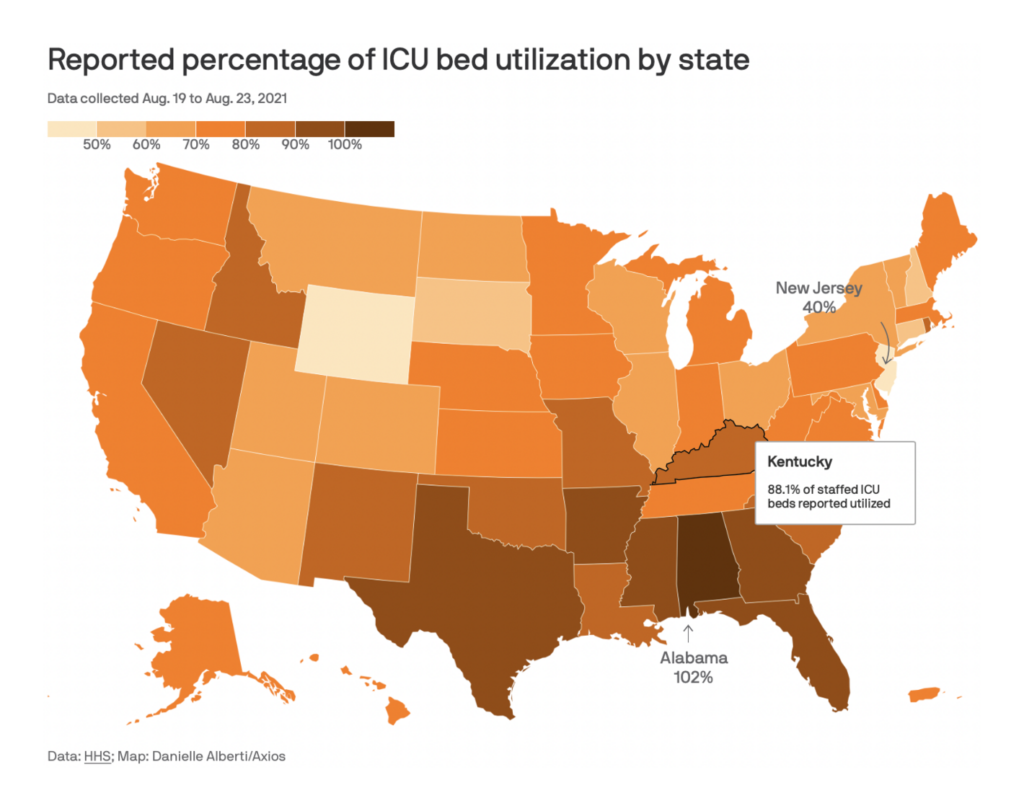
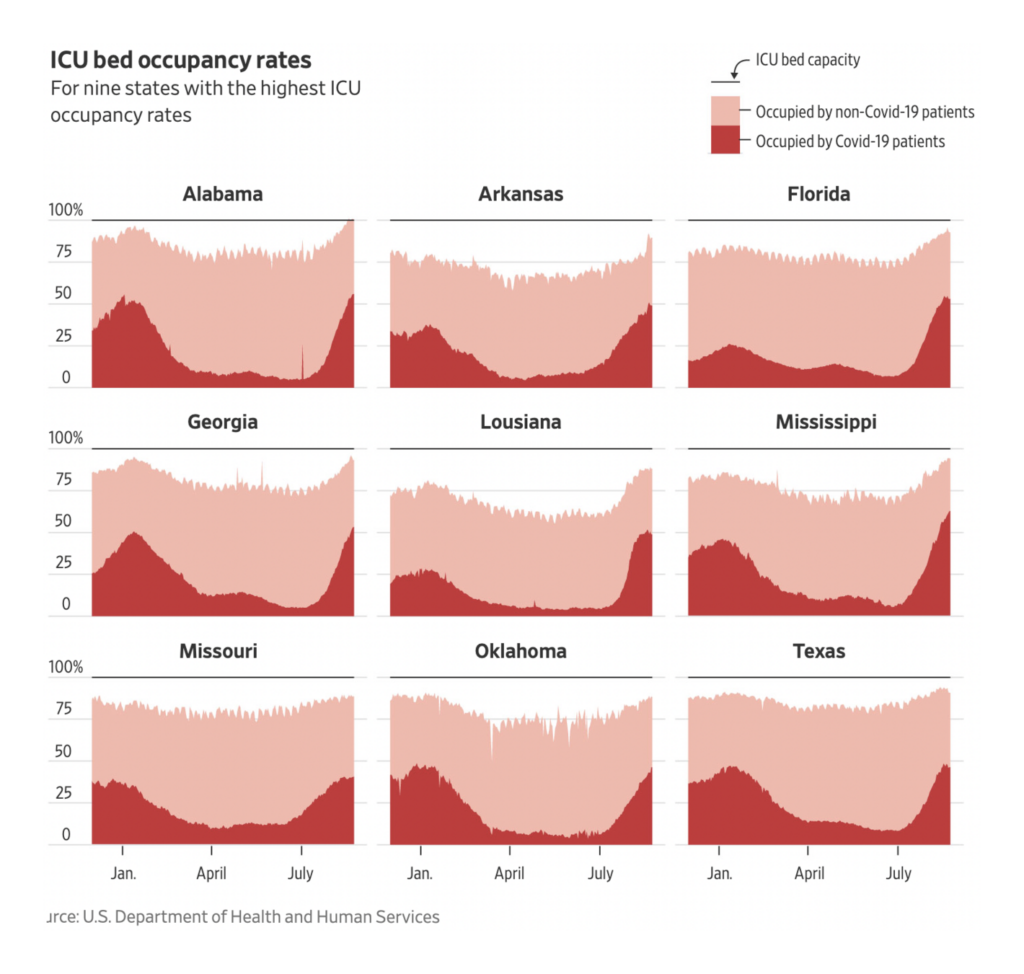
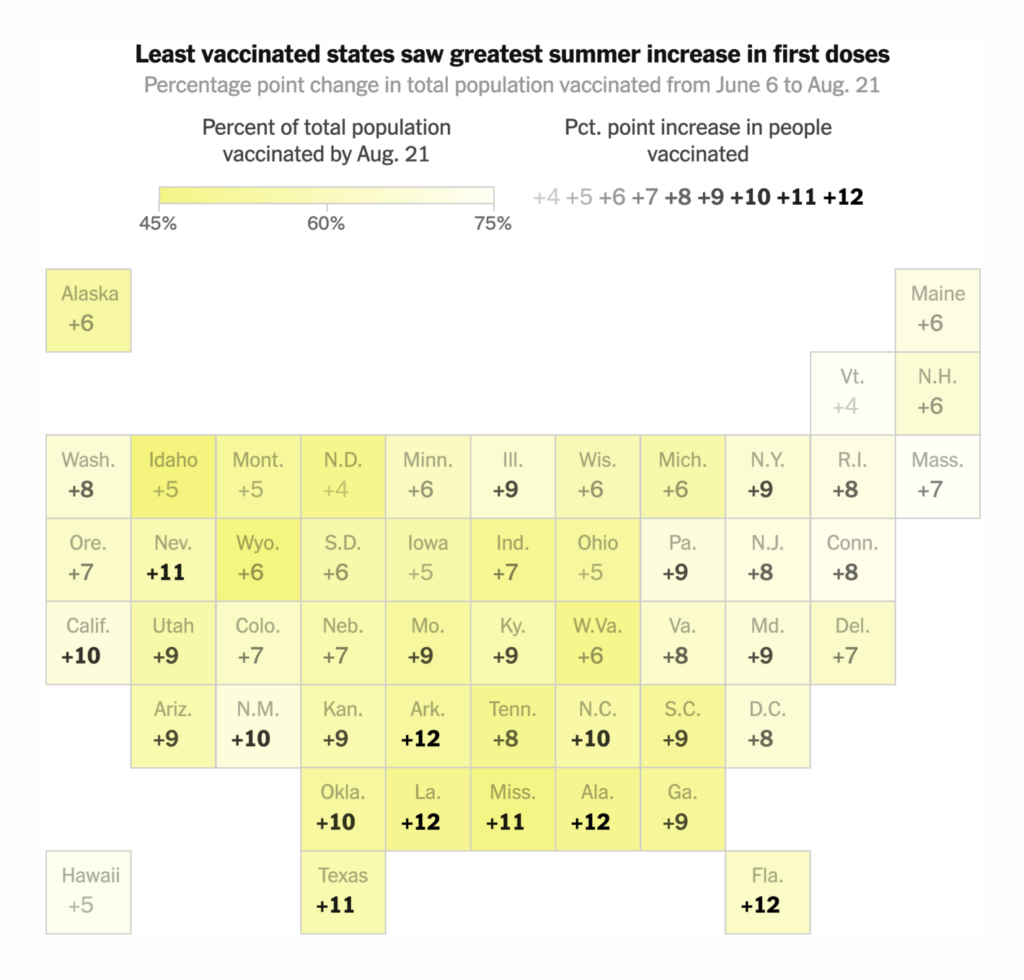
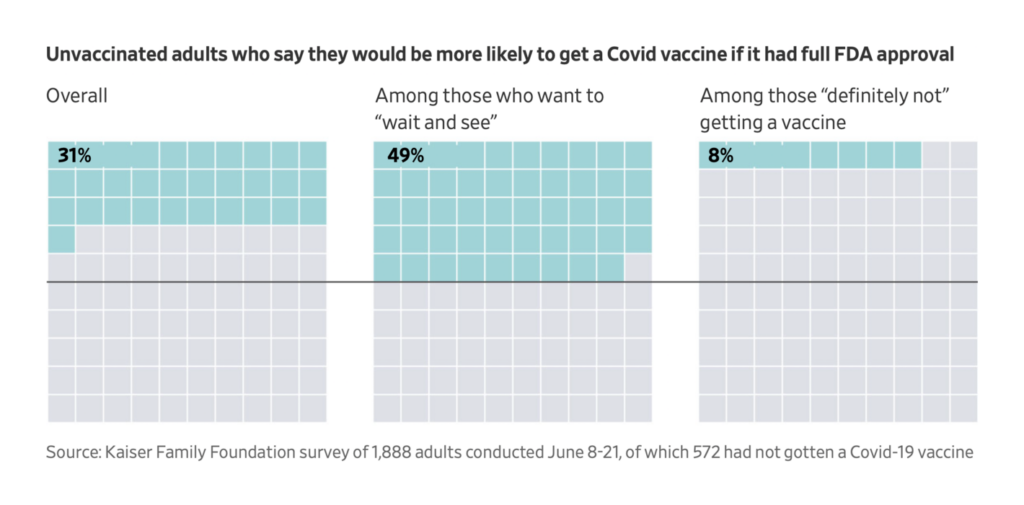
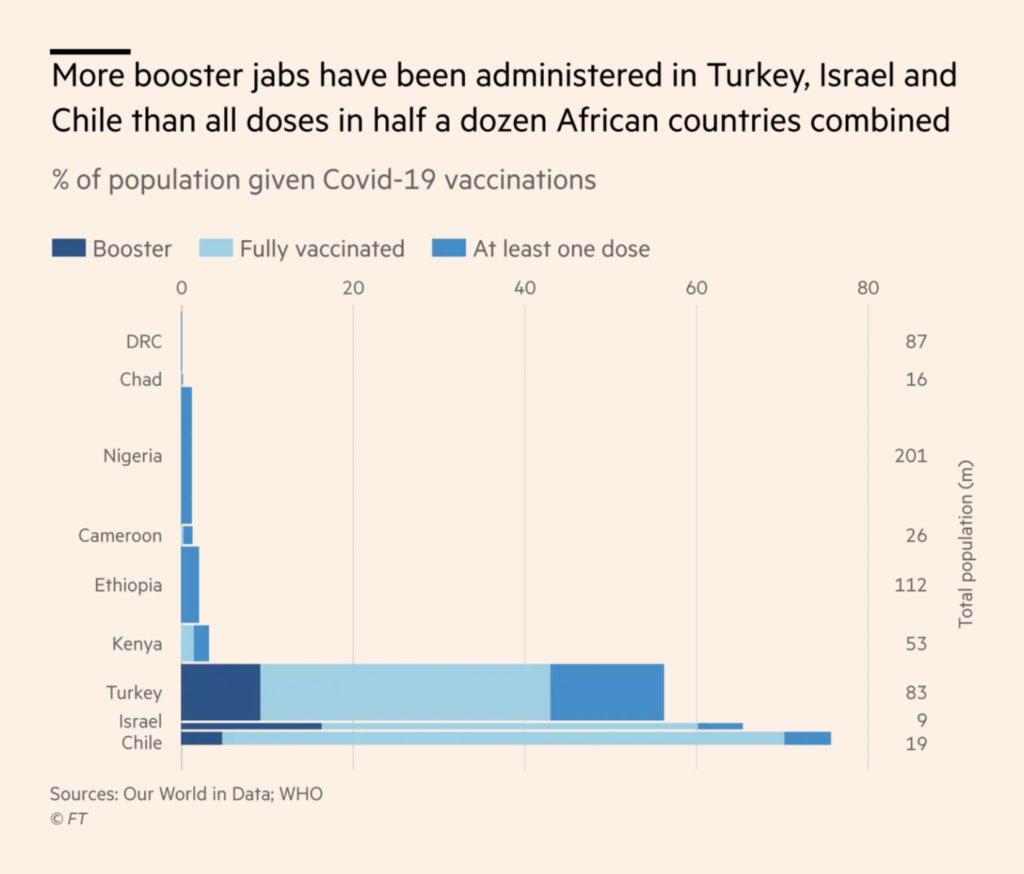
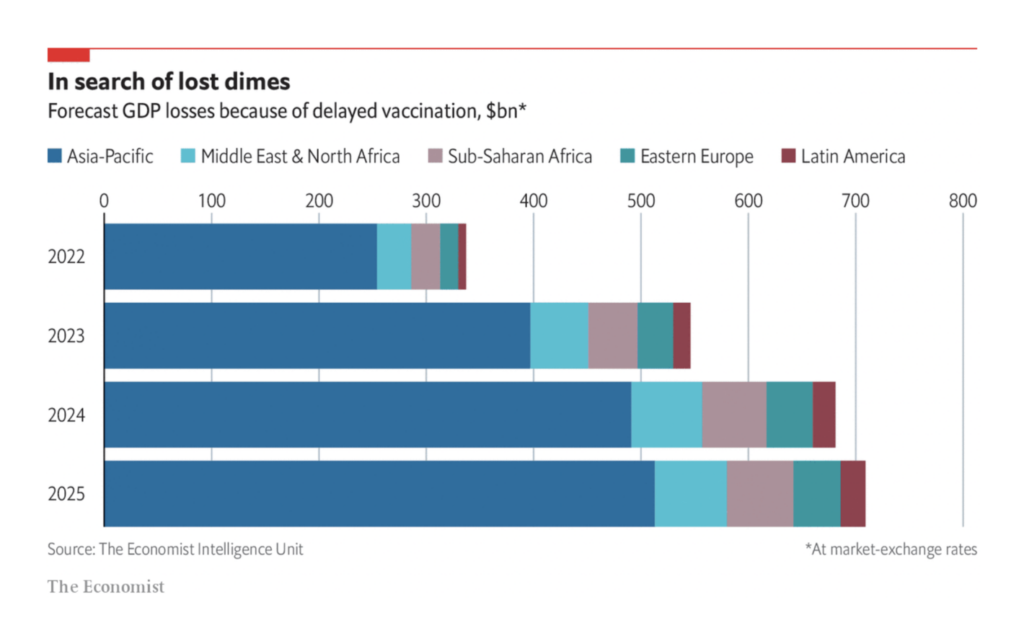
And there’s no denying it: COVID is back in many countries, and with it, lots of new charts. With many children still completely unvaccinated, the new school year is beginning in a state of anxiety:
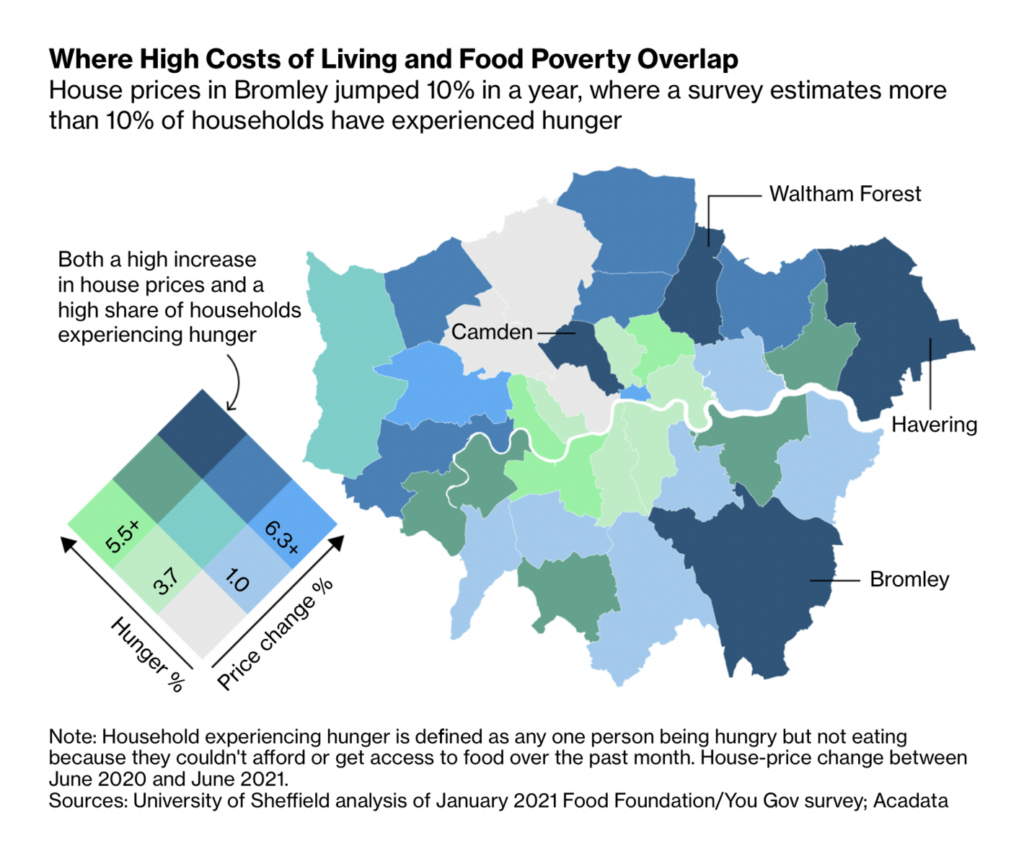
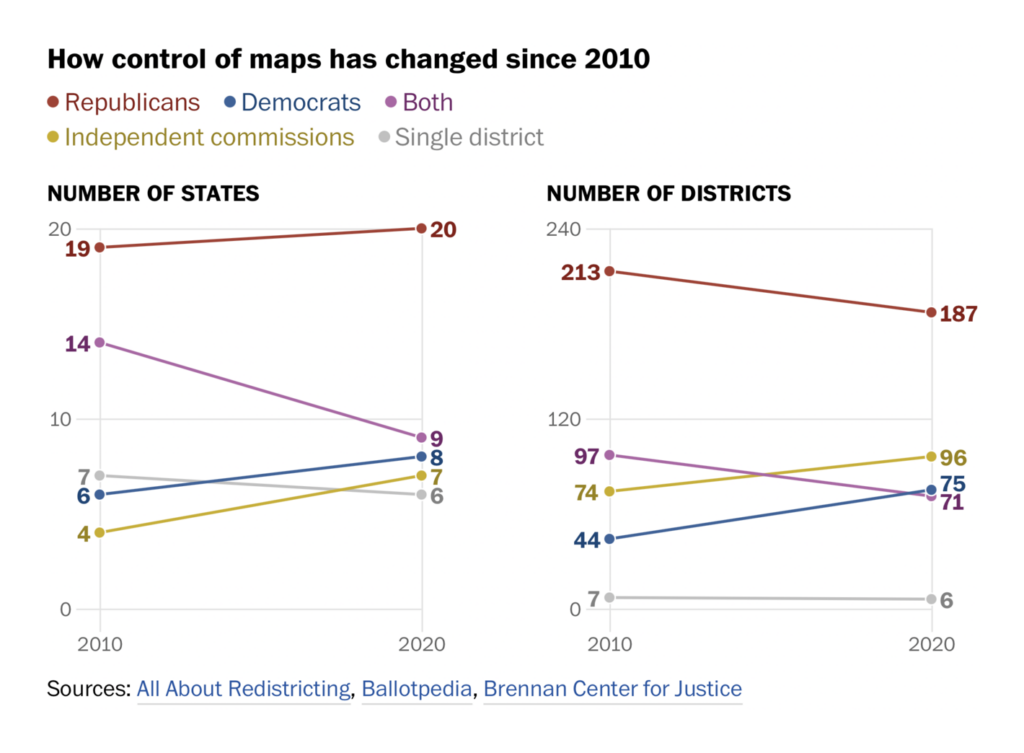
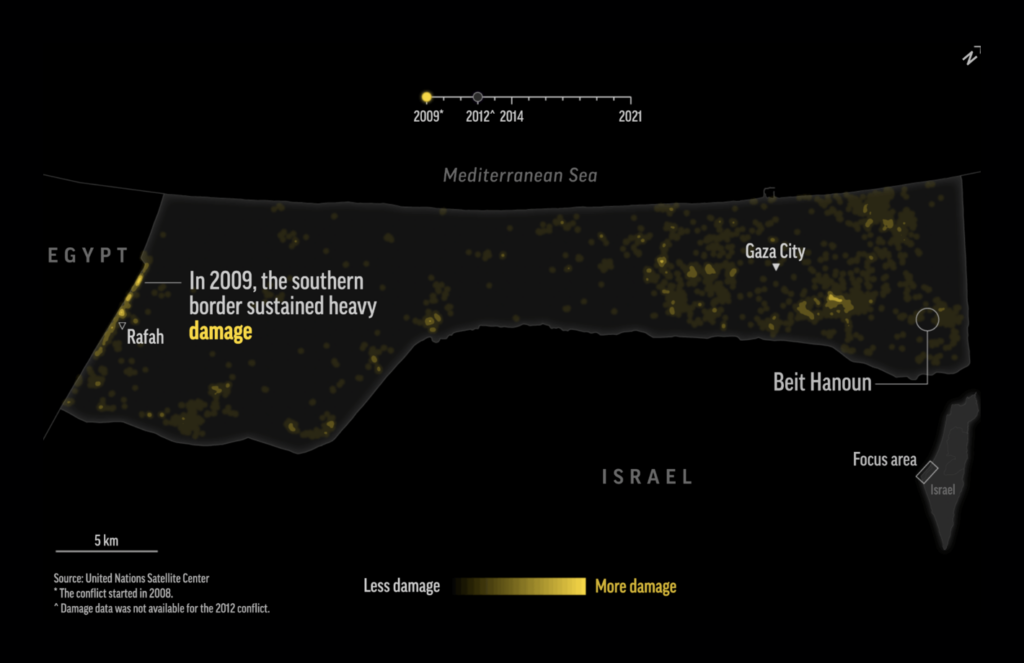
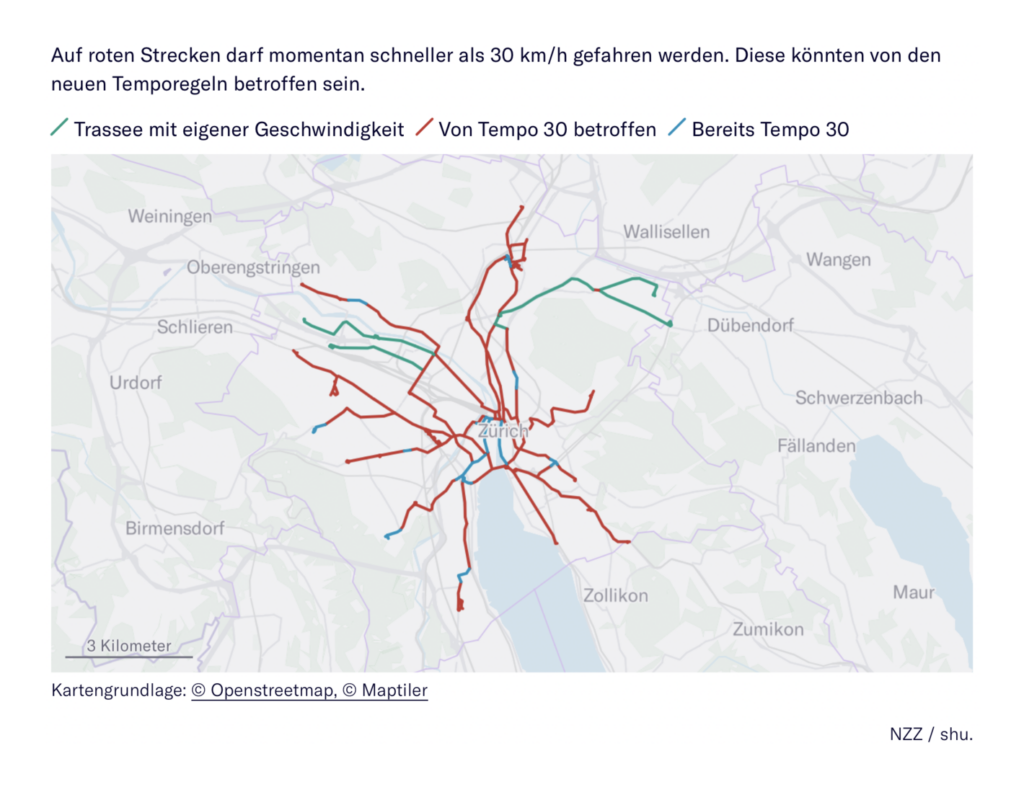
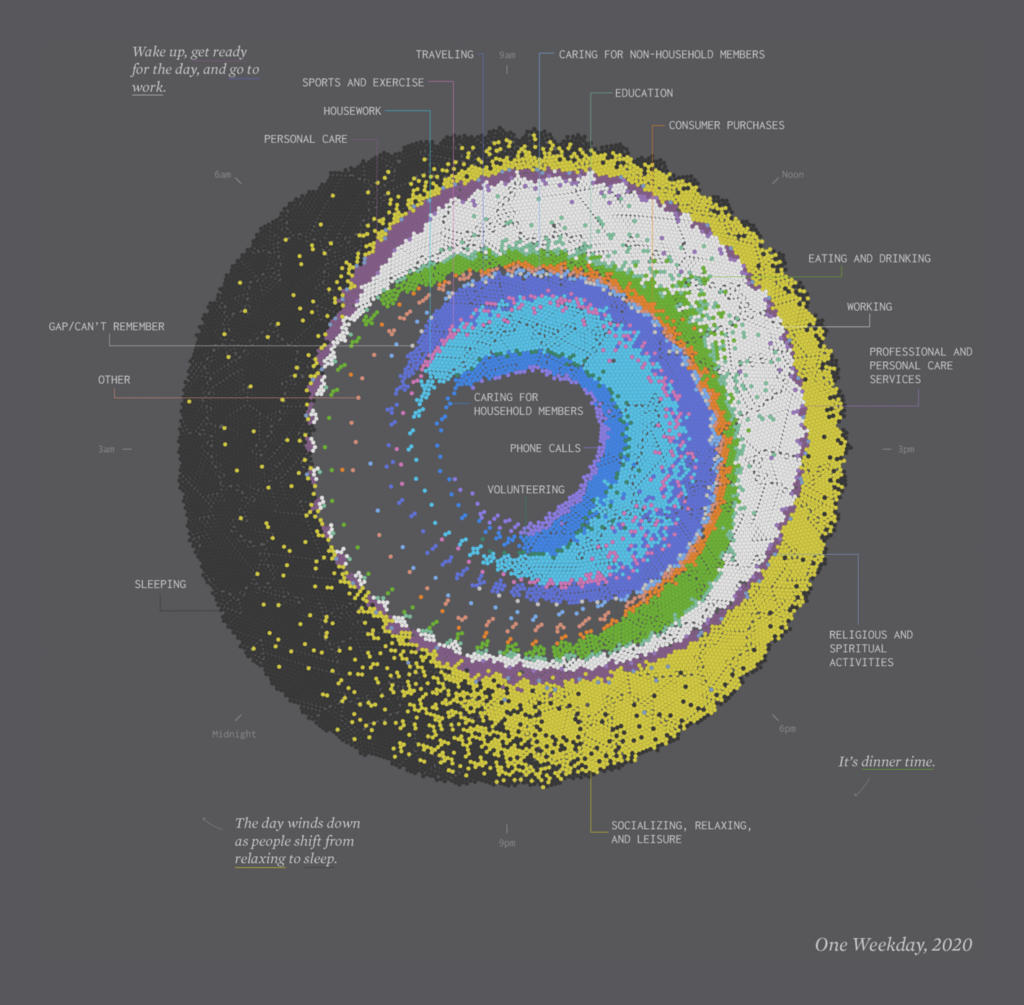
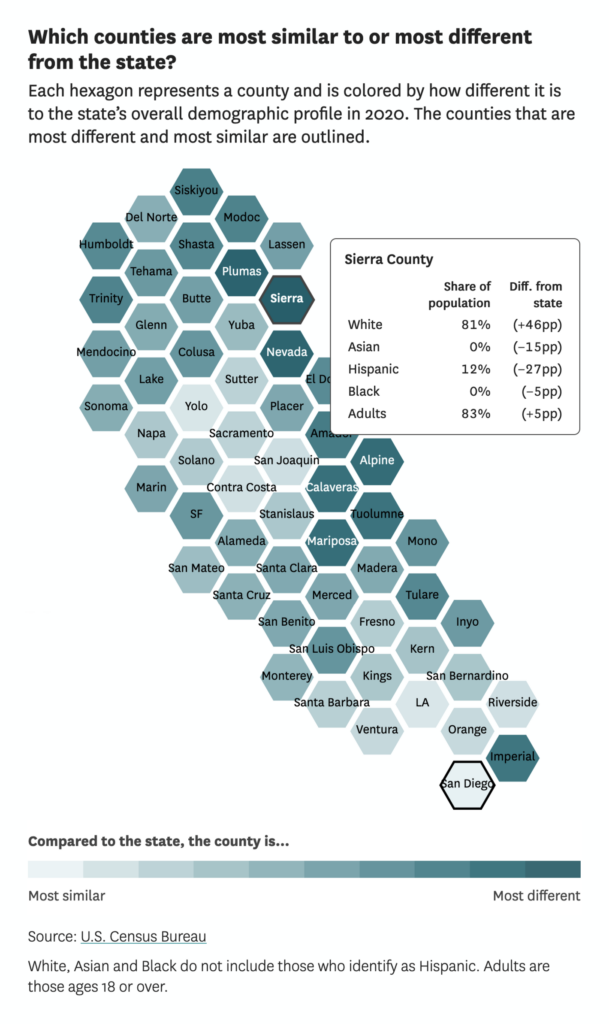
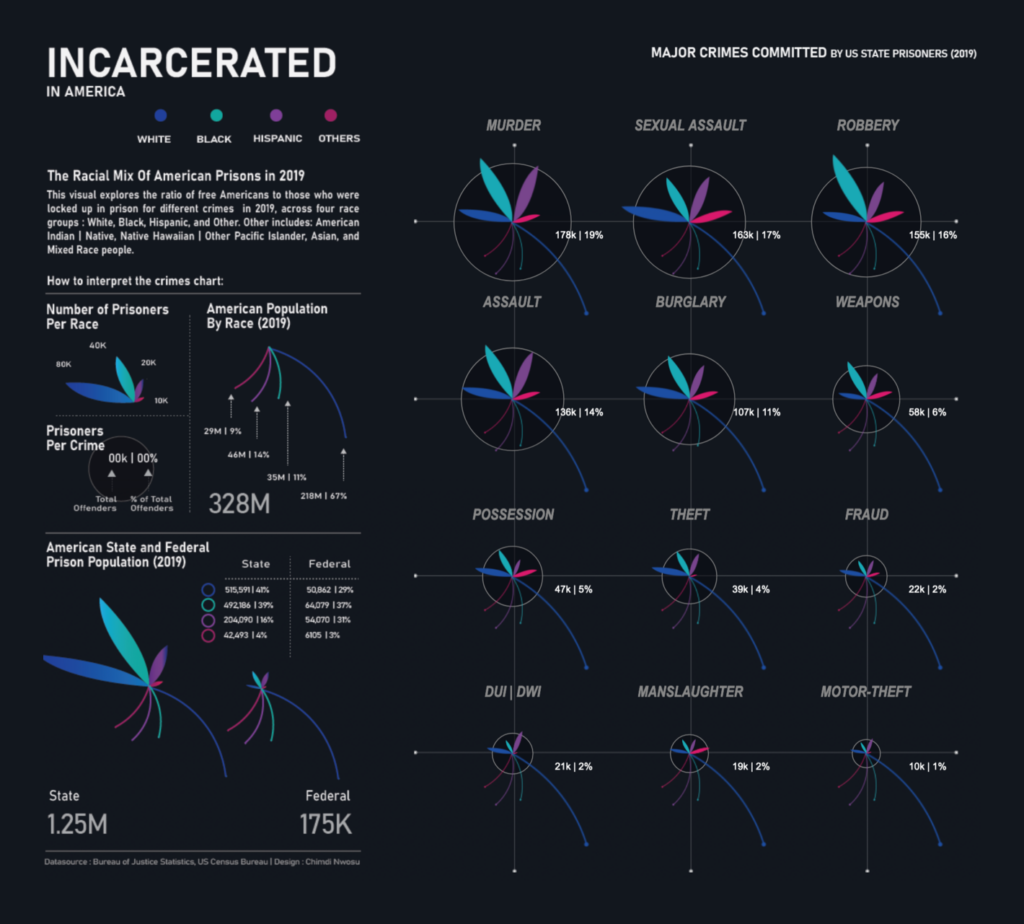
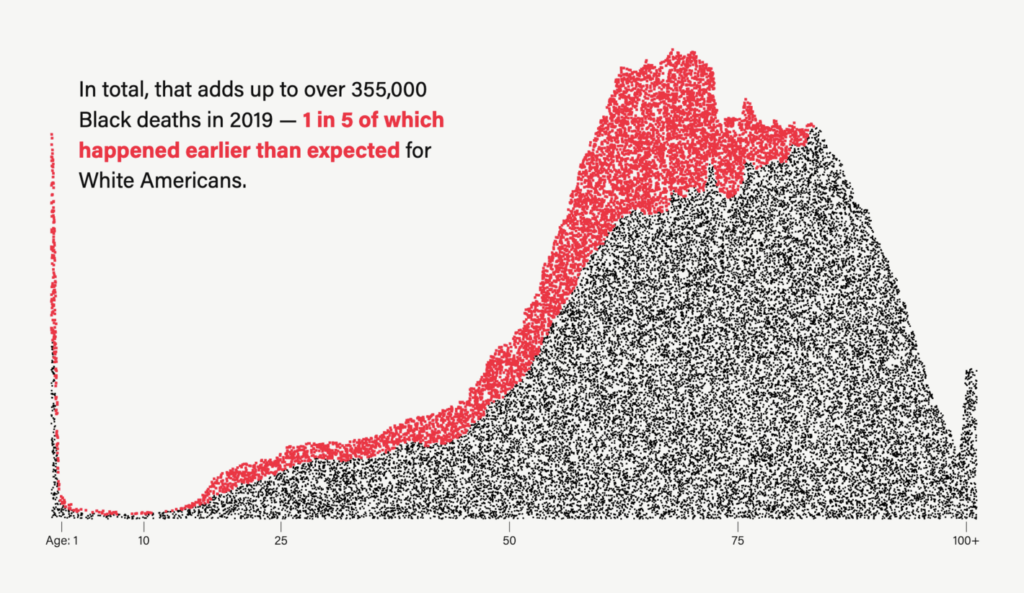
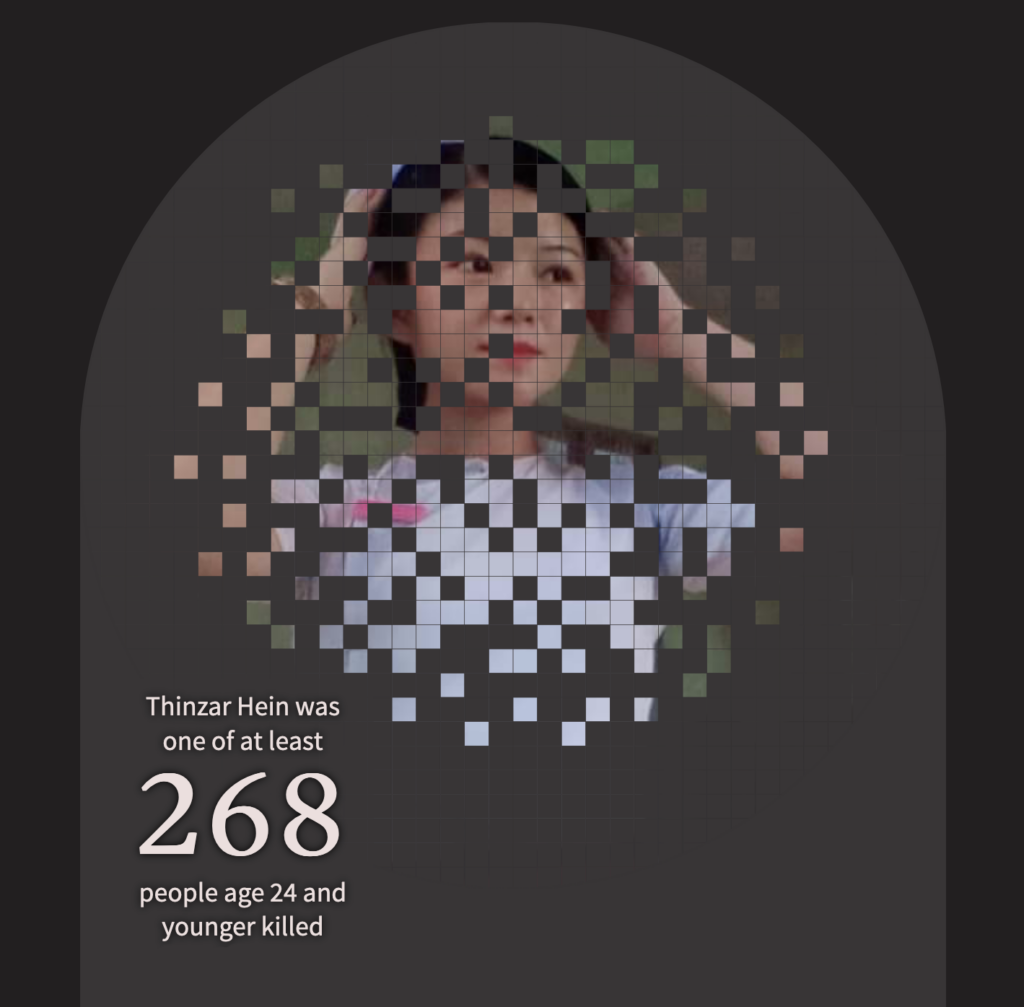
Maps this week covered damaged infrastructure in Gaza and transit in Zürich. Charts looked at racial disparities in the U.S. and how we’re spending our time each day:
R developer and academic Kyle Walker made his new book Analyzing US Census Data: Methods, Maps, and Models in R available to read online, with lots of explanations and visualizations about the census. Find it here or get an overview in this Twitter thread.
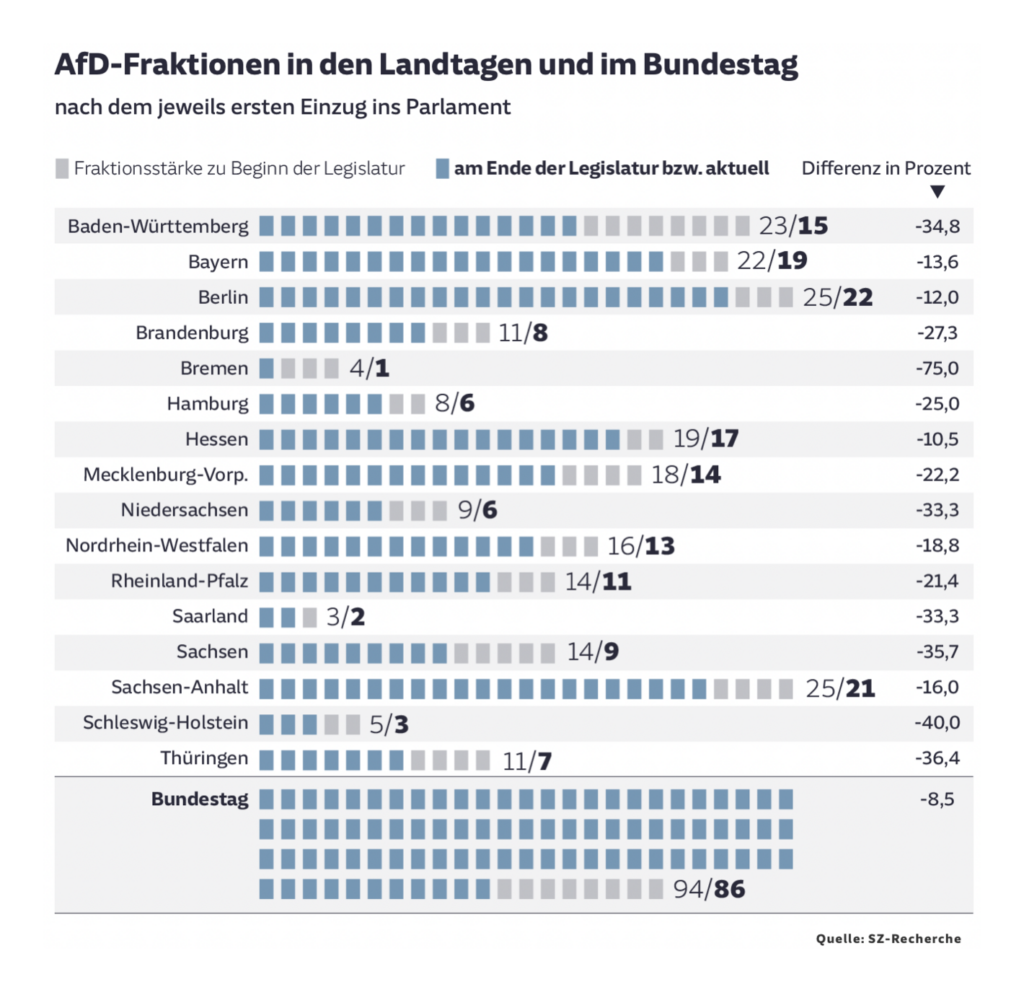
In case you missed it: We prepared reusable and live-updating visualizations for the upcoming election in Germany. Find them here.
Help us make this dispatch better! We’d love to hear which newsletters, blogs, or social media accounts we need to follow to learn about interesting projects, especially from less-covered parts of the world (Asia, South America, Africa). Write us at hello@datawrapper.de or leave a comment below.
Rose Mintzer-Sweeney
(she/her, @rosemintzers) is a data vis writer on Datawrapper's communications team. She likes words, numbers, pictures, and all possible combinations of the same. Rose lives in Berlin.
Lisa Charlotte Muth
(she/her, @lisacmuth, @lisacmuth@vis.social) is Datawrapper’s head of communications. She writes about best practices in data visualization and thinks of new ways to excite you about charts and maps. Lisa lives in Berlin.


Comments