This article is brought to you by Datawrapper, a data visualization tool for creating charts, maps, and tables. Learn more.
Data Vis Dispatch, February 6
The best of last week’s big and small data visualizations
Welcome back to the 128th edition of Data Vis Dispatch! It’s an exciting week here at Datawrapper. We released a whole new chart type yesterday: small multiple lines! 🎉 As in every week, we’ll be publishing a collection of the best small and large data visualizations we find — but this time also some small multiples inspiration. To read more about the new chart type, check out our blog announcement and the Academy articles on creating and customizing multiple line charts in Datawrapper.
Recurring topics in this week’s Dispatch include water shortages, luxury homes, and more money.
Let’s dive right into the ✨ small multiple lines ✨ inspiration:
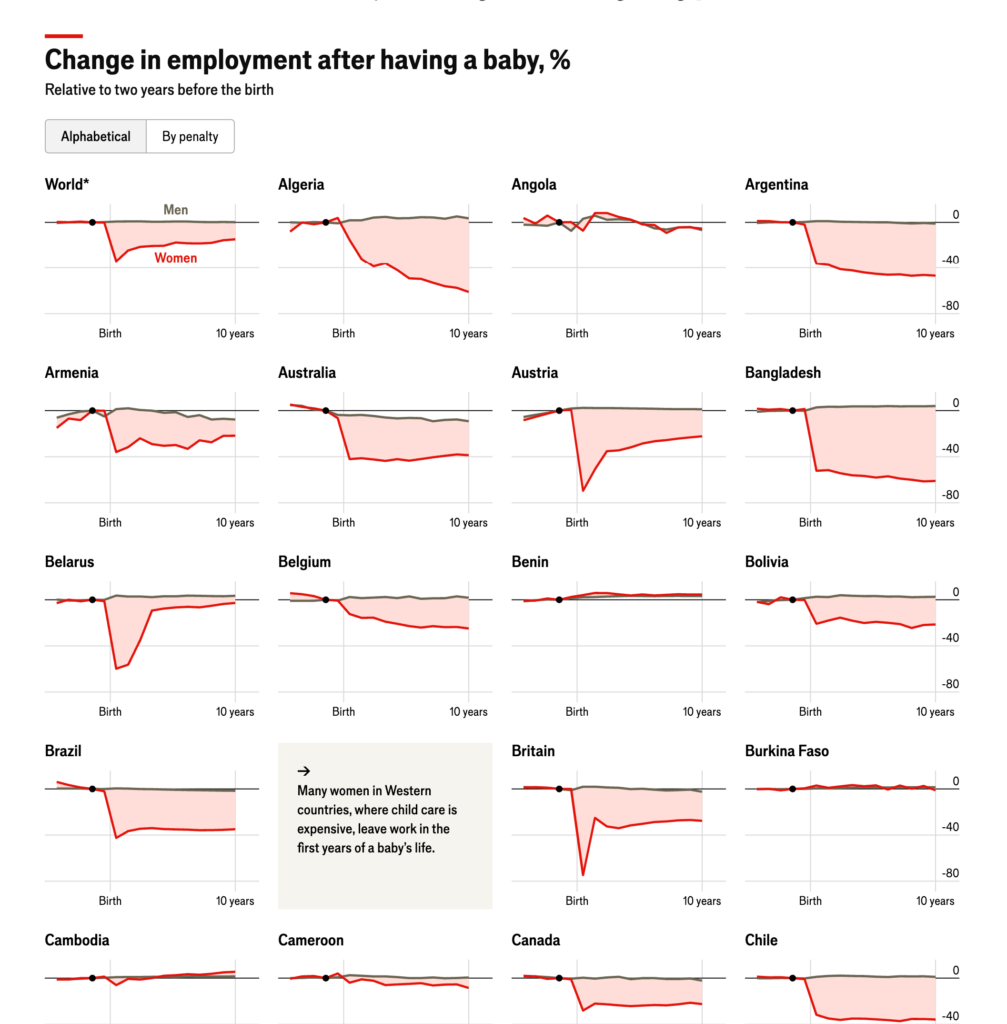
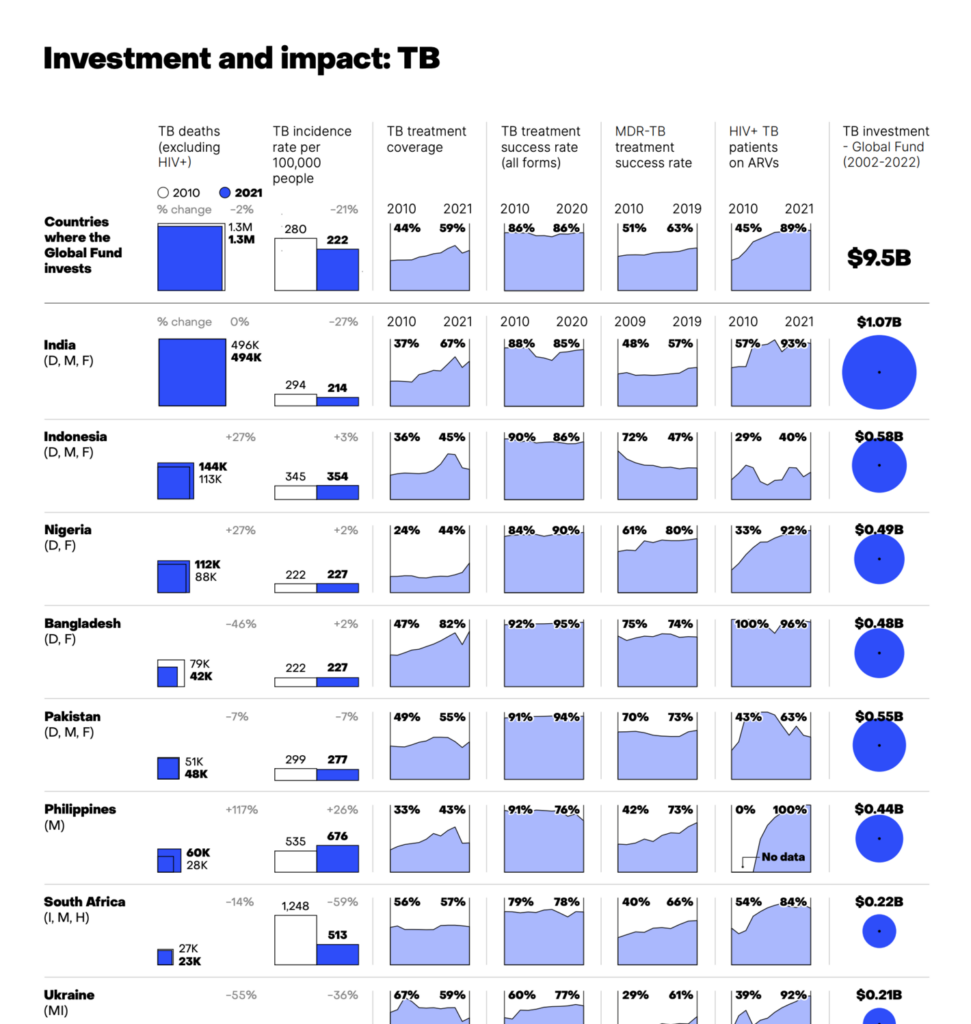
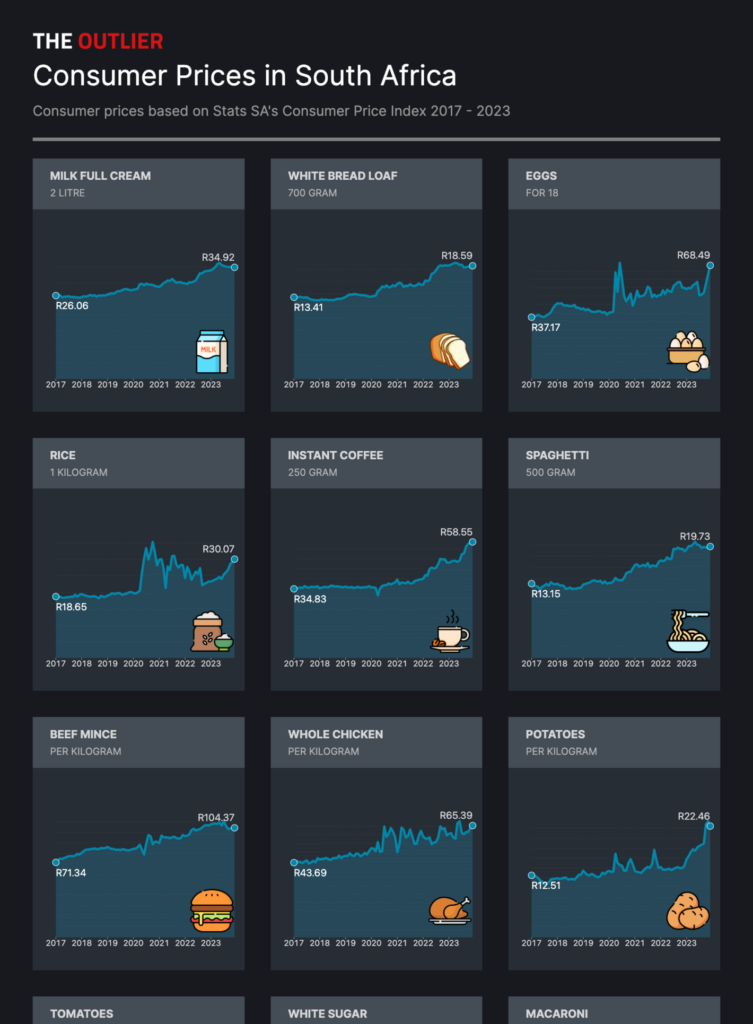

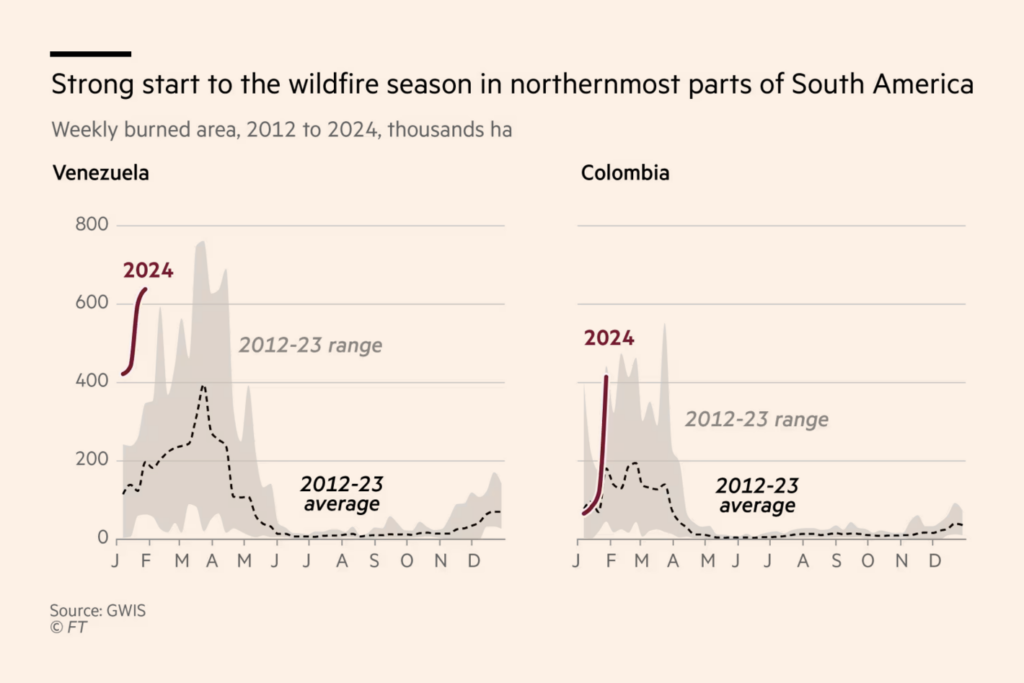
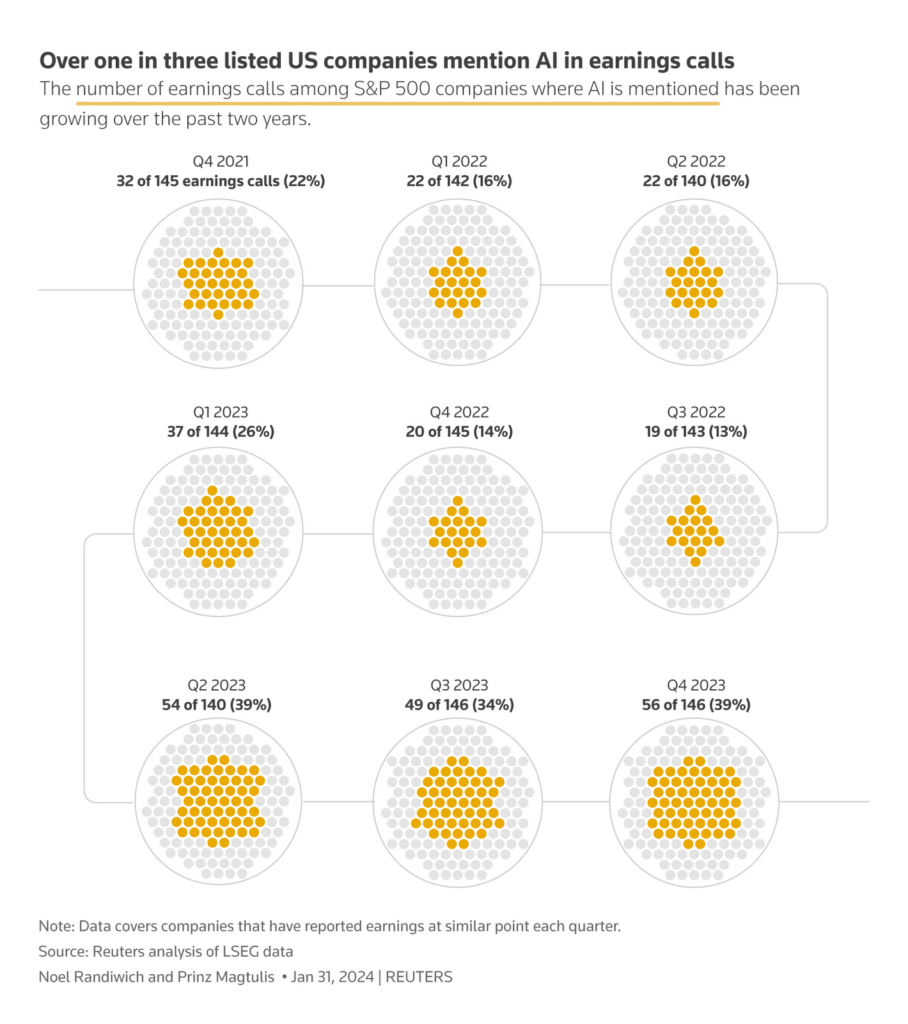
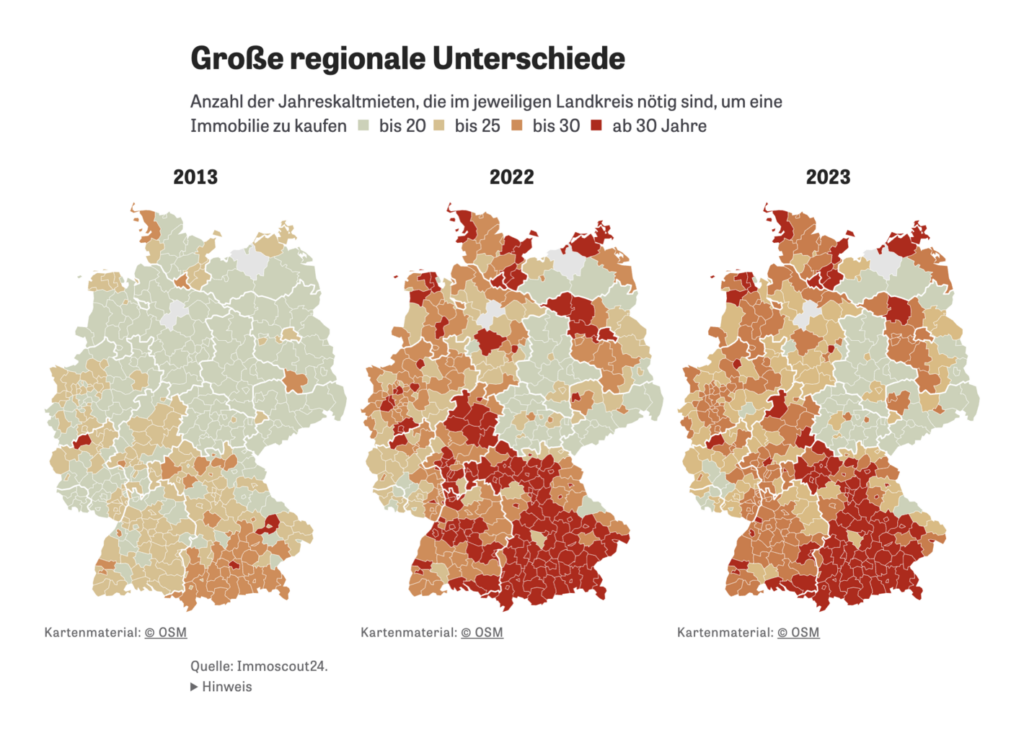
Small multiple lines are not the only visualizations in the small multiples family! We couldn’t help but collect a few other visualization types that show the wide range of small multiples:

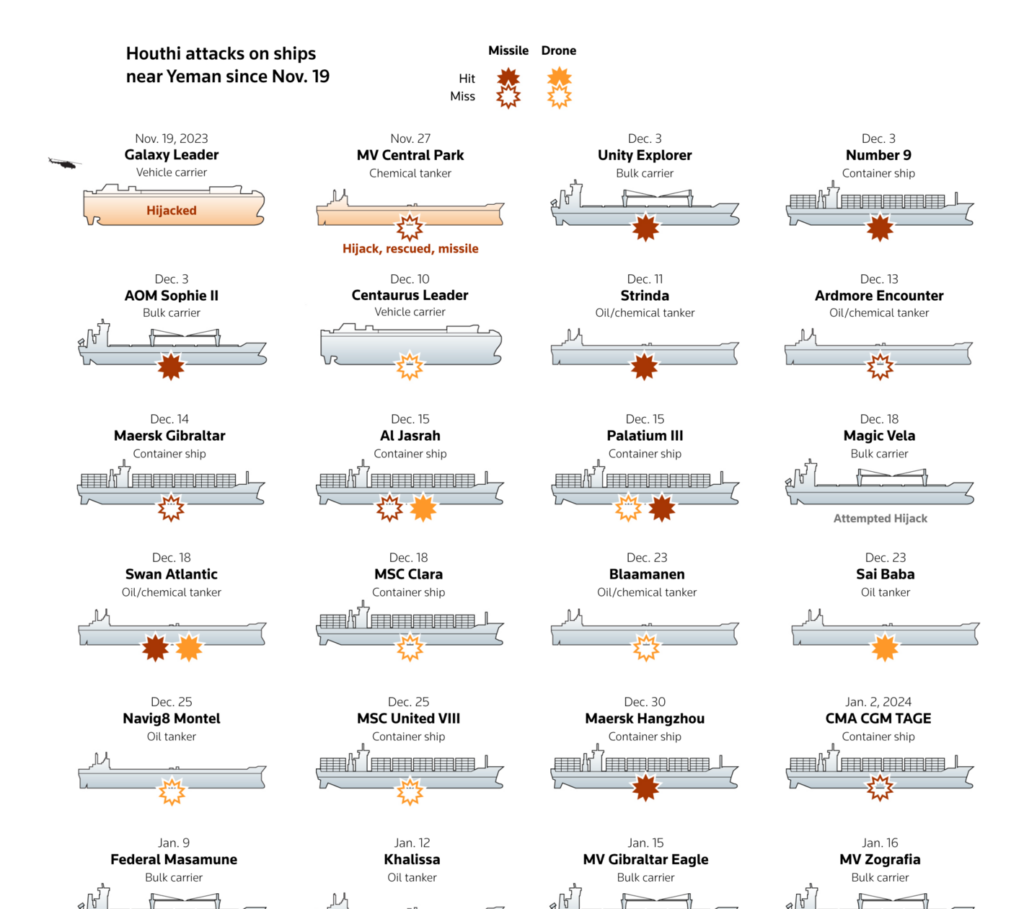
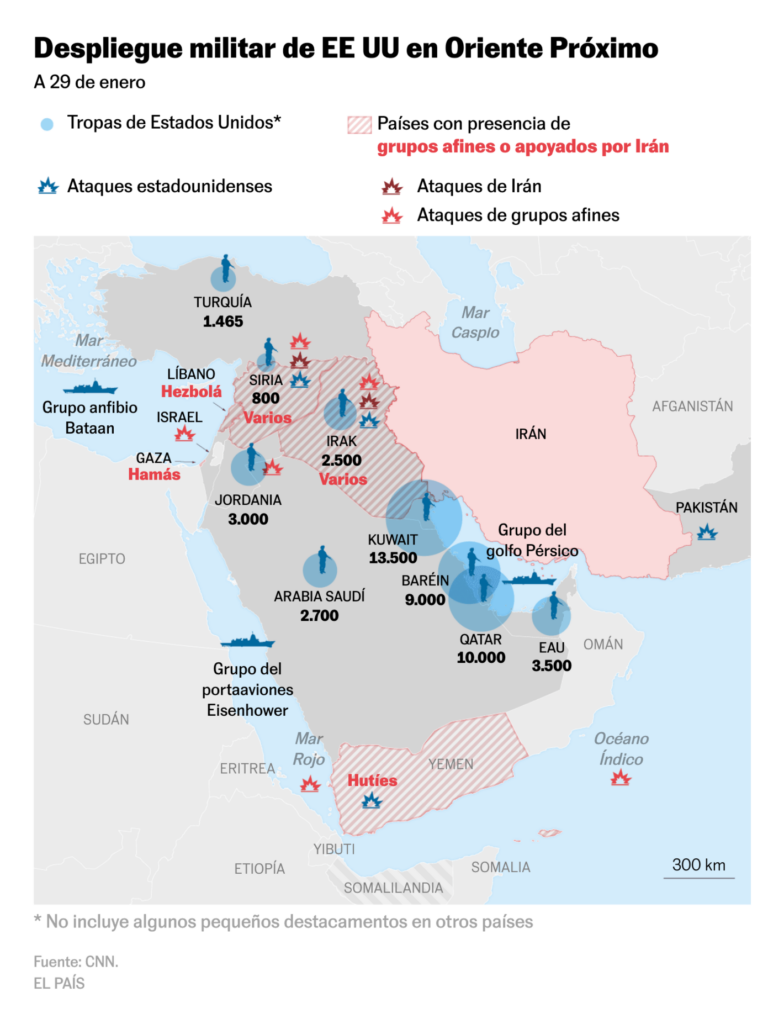
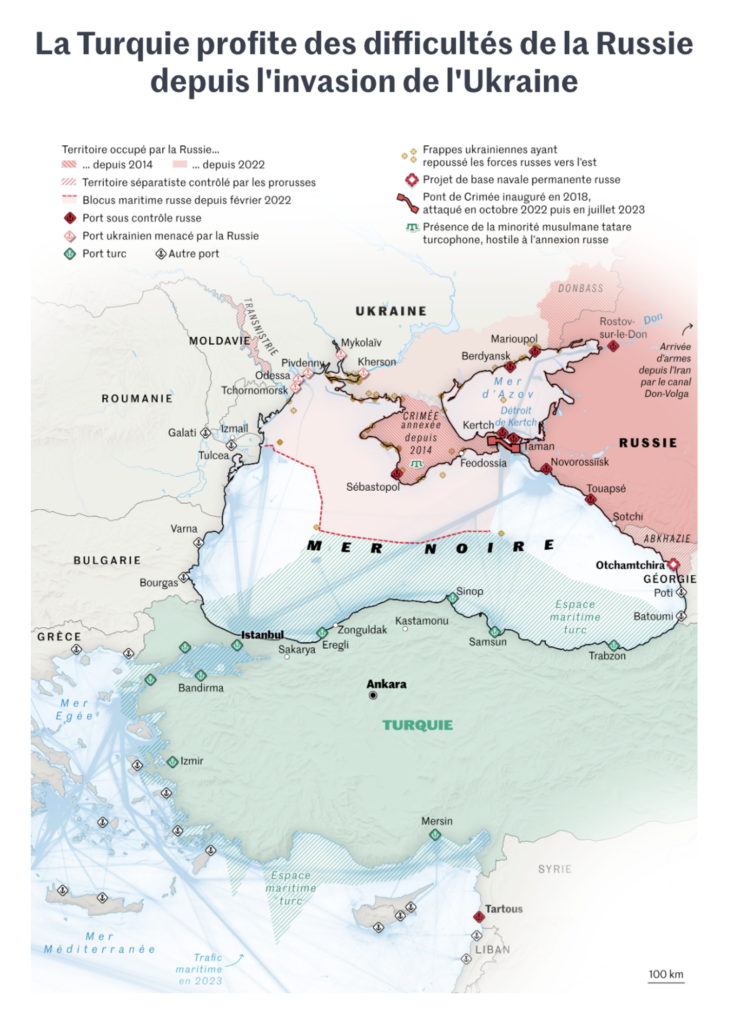
Three maps covered conflicts around the world, from U.S. troops in the Middle East, to China’s position towards Taiwan, to how Turkey profits from war between Russia and Ukraine:
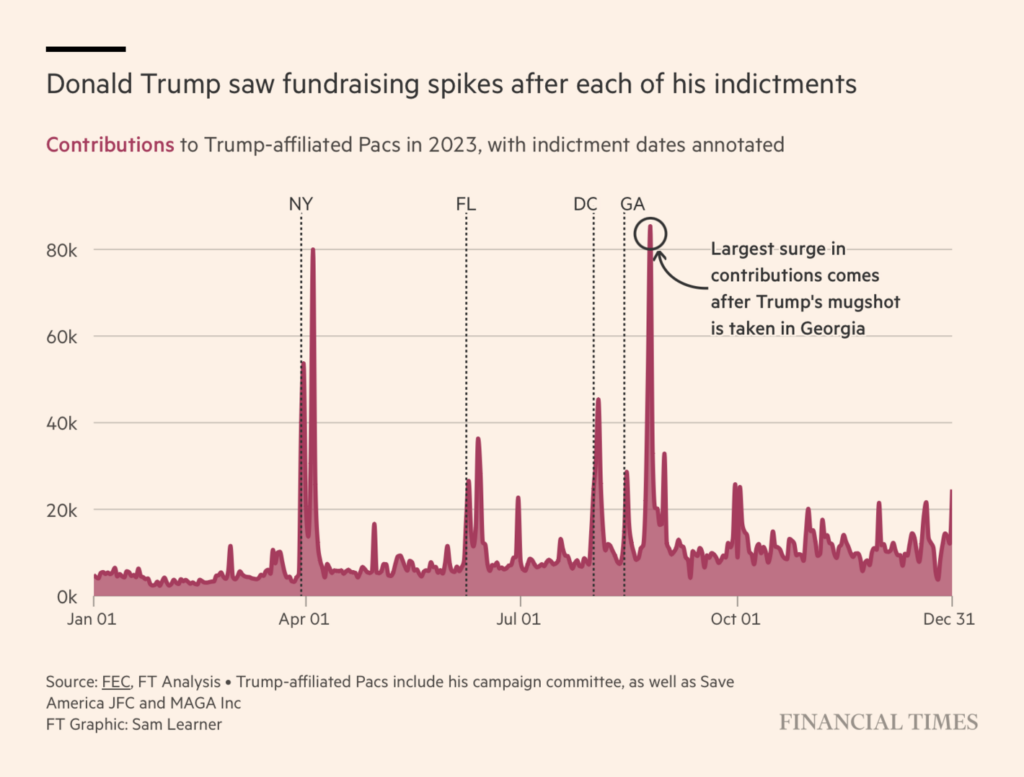
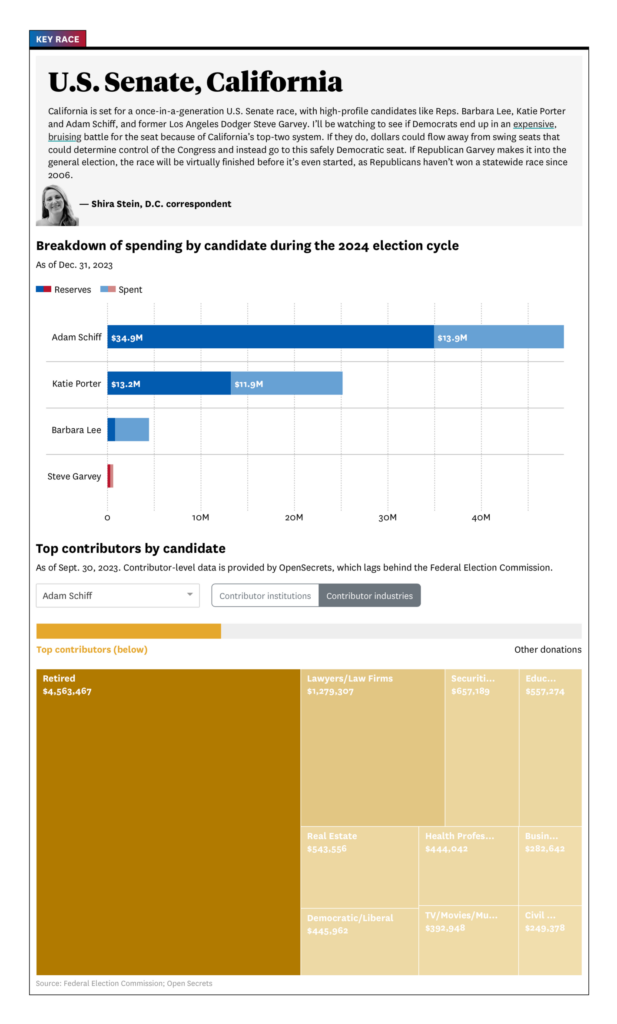
Speaking of profits, money played an important role in this week’s visualizations. Not least its influence on the U.S. elections:
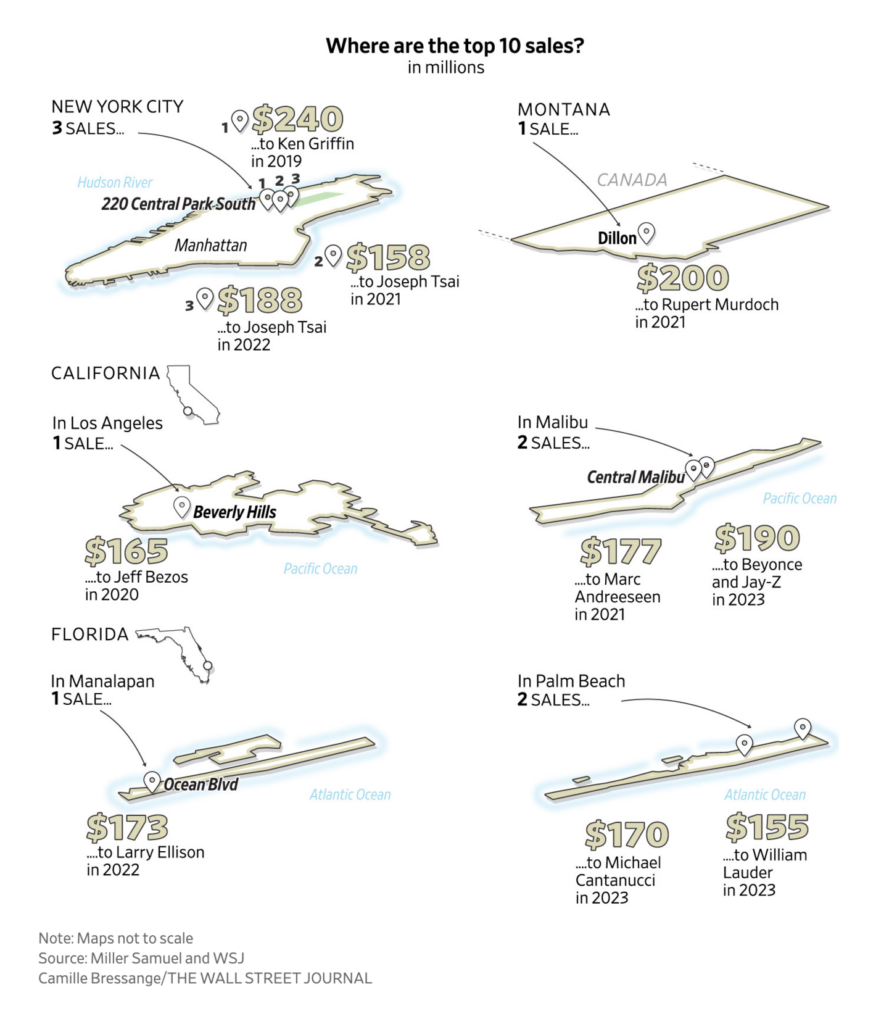
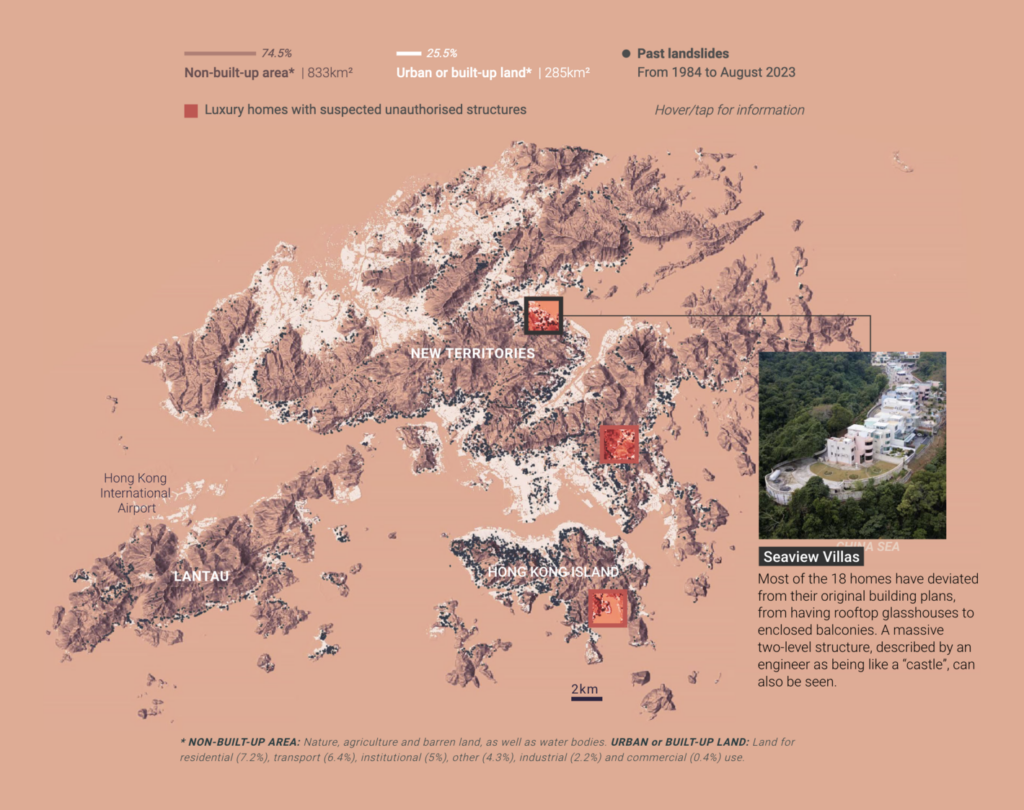
Do you know what costs a lot of money? Big luxury home sales:
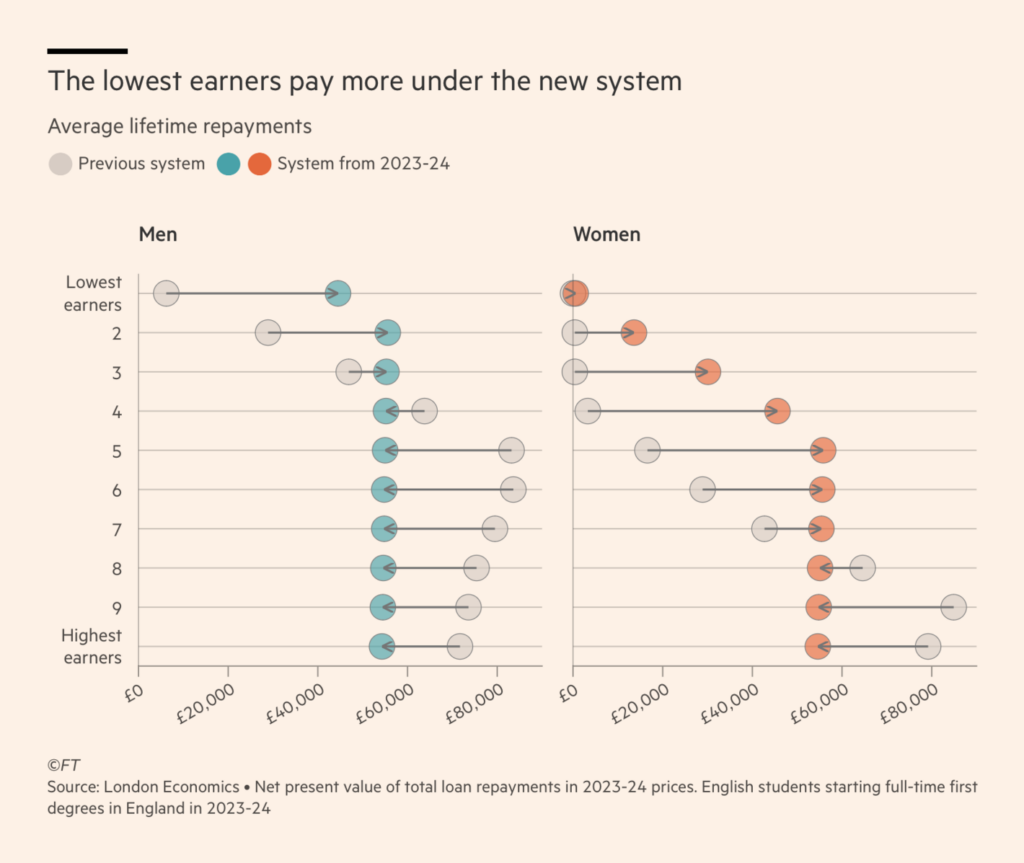
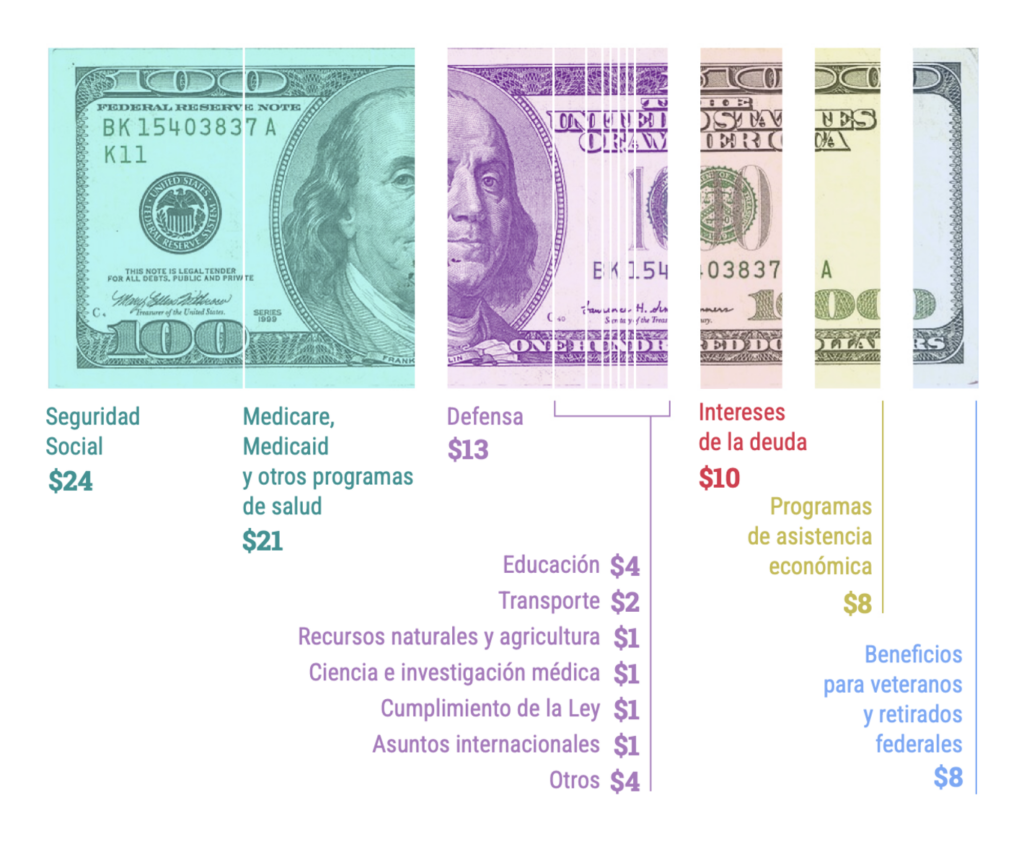
For more on money, we have the new student loan system in England, investments in Elon Musk companies, and the burning question, “Where do our taxes go?“:

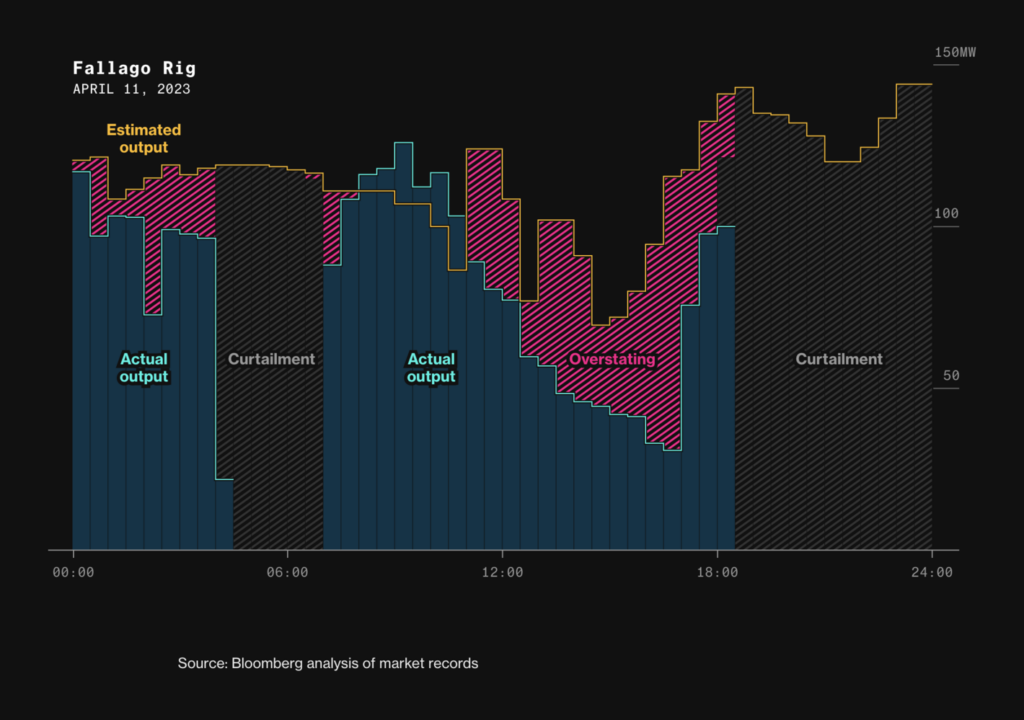
This week’s visualizations on water, wind, and energy:

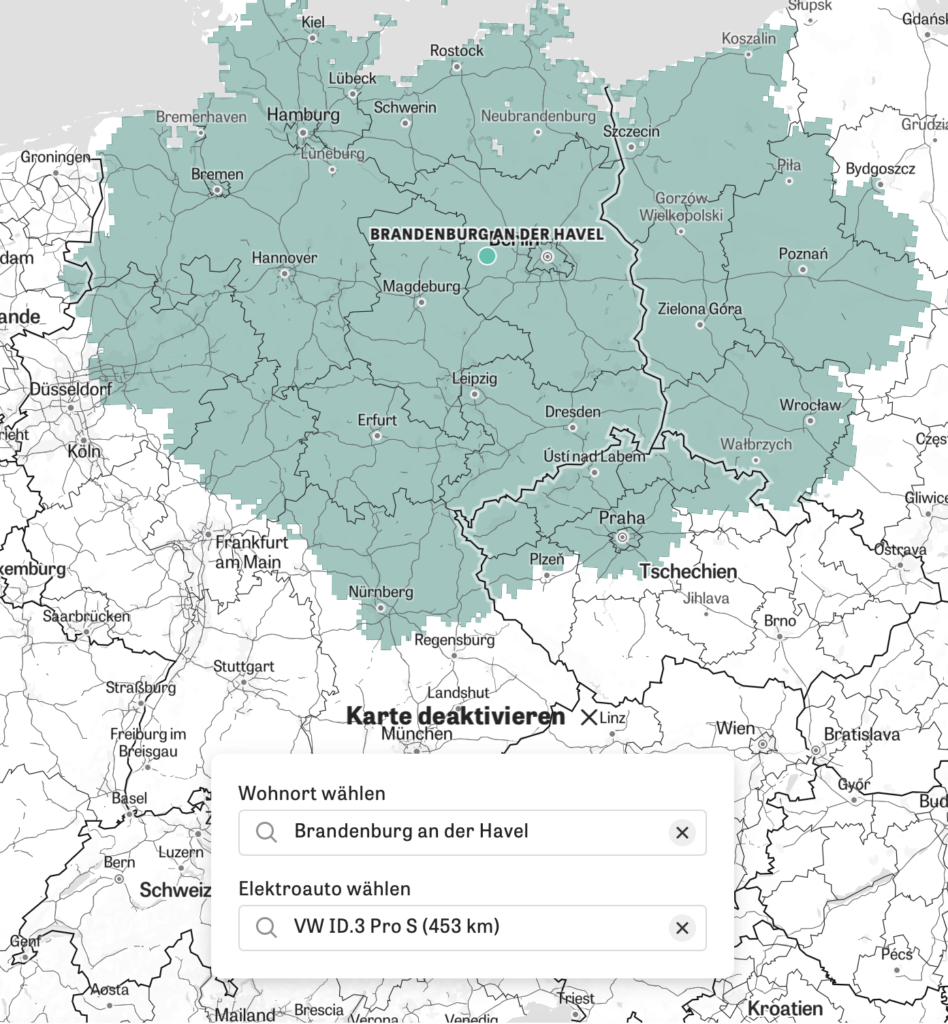
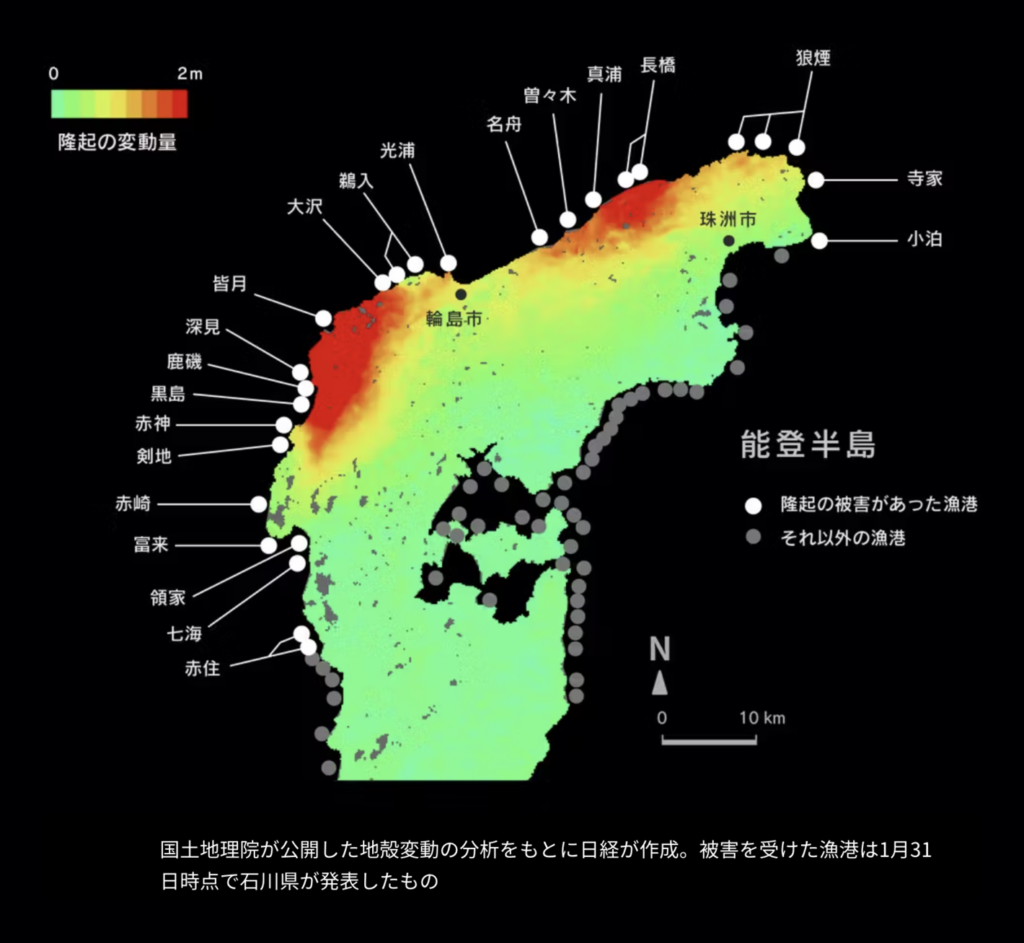
The earth shakes, the earth breathes:
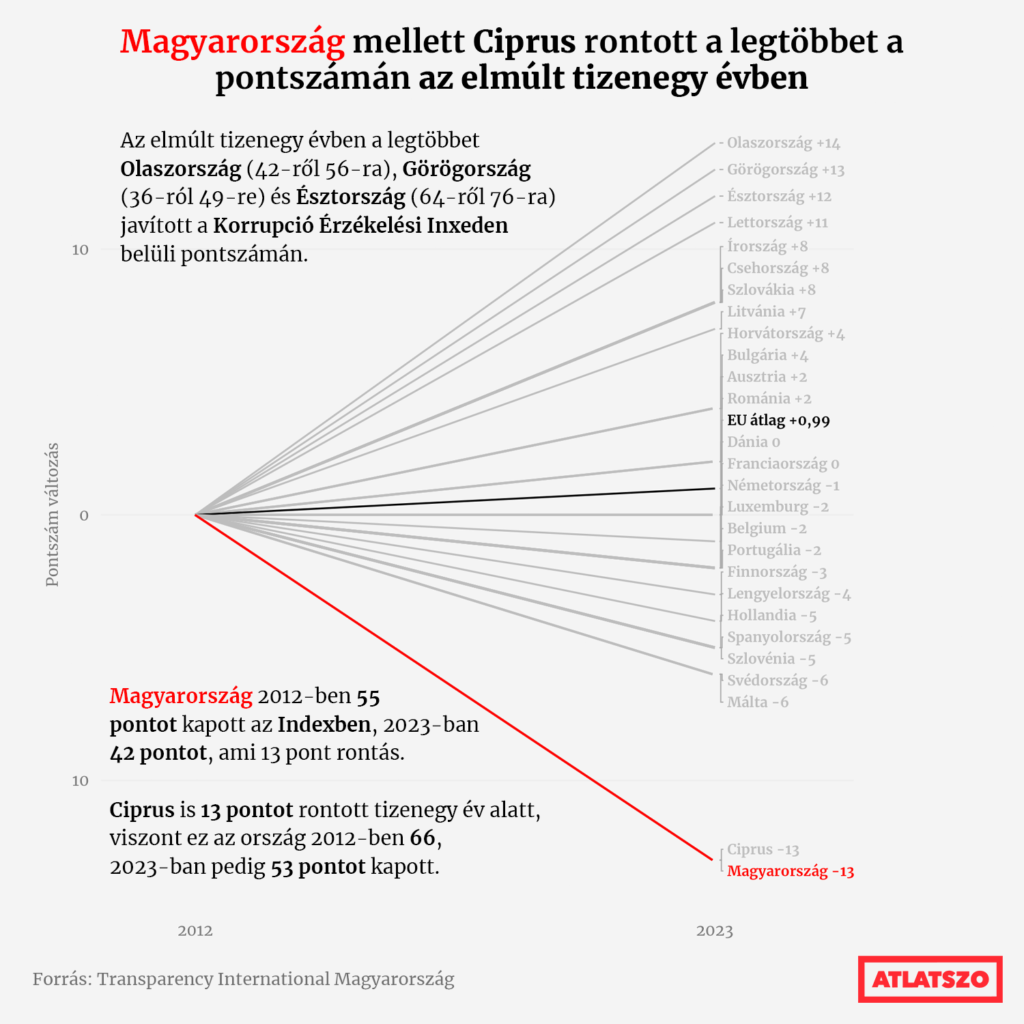
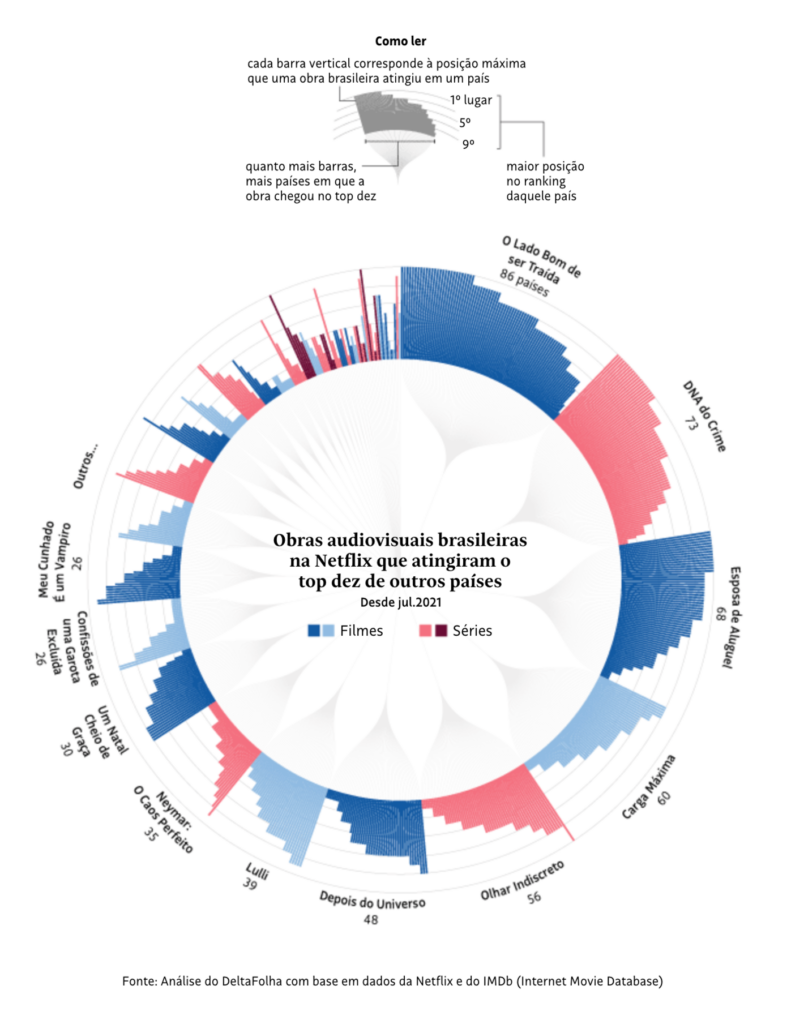
Finally, we have everything from corruption in Europe, to the world’s favorite Brazilian films, to the effects of long COVID:
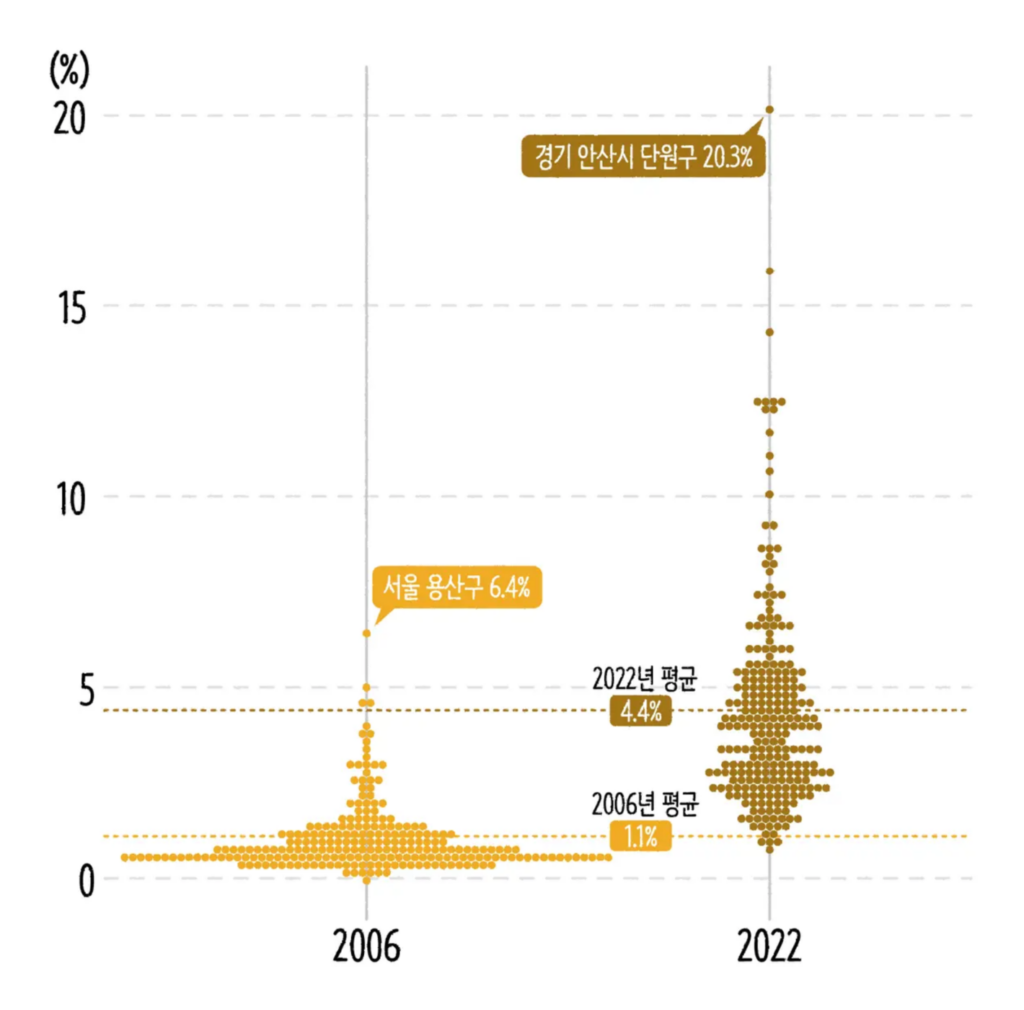
What else we found interesting

Help us make this dispatch better! We’d love to hear which newsletters, blogs, or social media accounts we need to follow to learn about interesting projects, especially from less-covered parts of the world (Asia, South America, Africa). Write us at hello@datawrapper.de or leave a comment below.
Want the Dispatch in your inbox every Tuesday? Sign up for our Blog Update newsletter!


Comments