Data Vis Dispatch, January 14: Fire, congestion, and Greenland
January 14th, 2025
11 min
This article is brought to you by Datawrapper, a data visualization tool for creating charts, maps, and tables. Learn more.
The best of last week’s big and small data visualizations
Welcome back to the 52nd edition of Data Vis Dispatch! Every week, we’ll be publishing a collection of the best small and large data visualizations we find, especially from news organizations — to celebrate data journalism, data visualization, simple charts, elaborate maps, and their creators.
Recurring topics this week include Hong Kong history, war in Ukraine, and the U.S. Supreme Court.
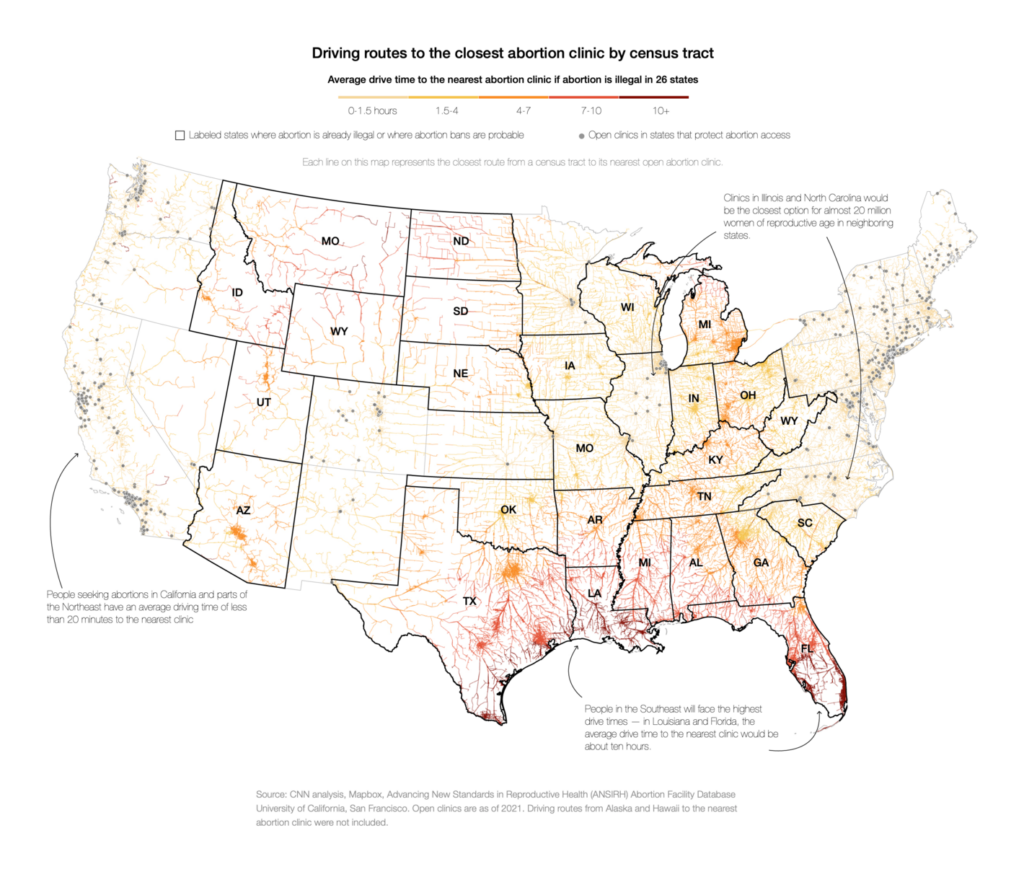
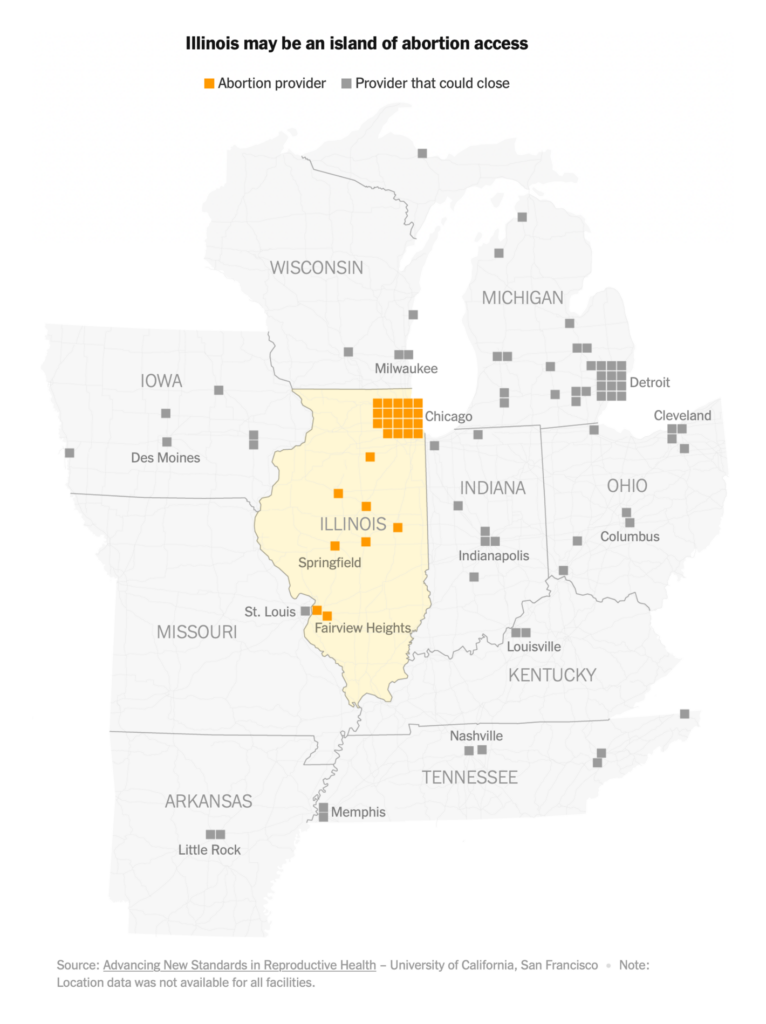
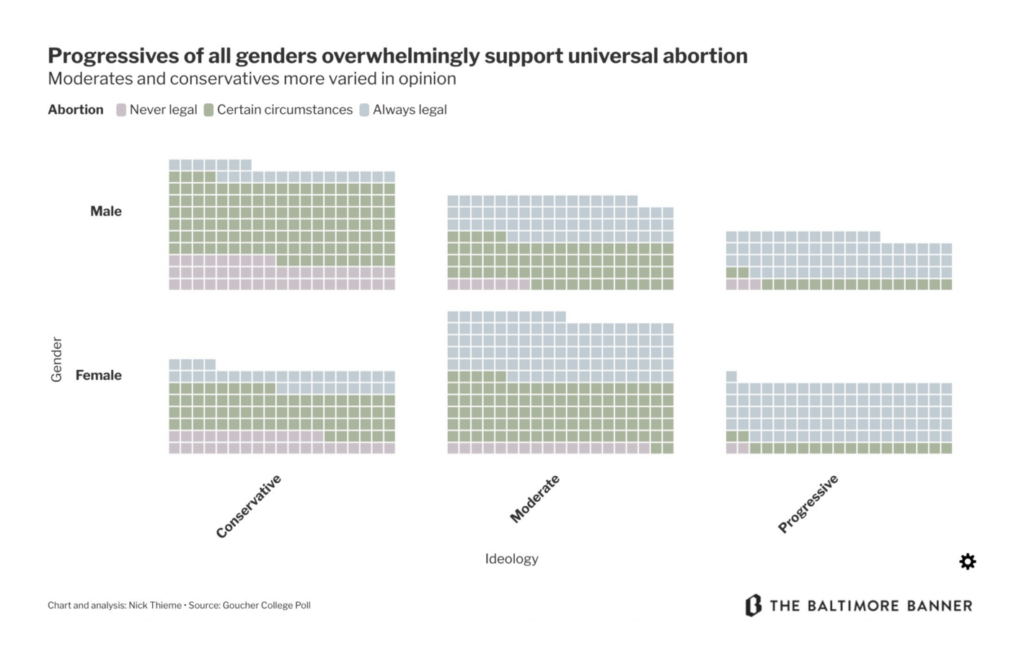
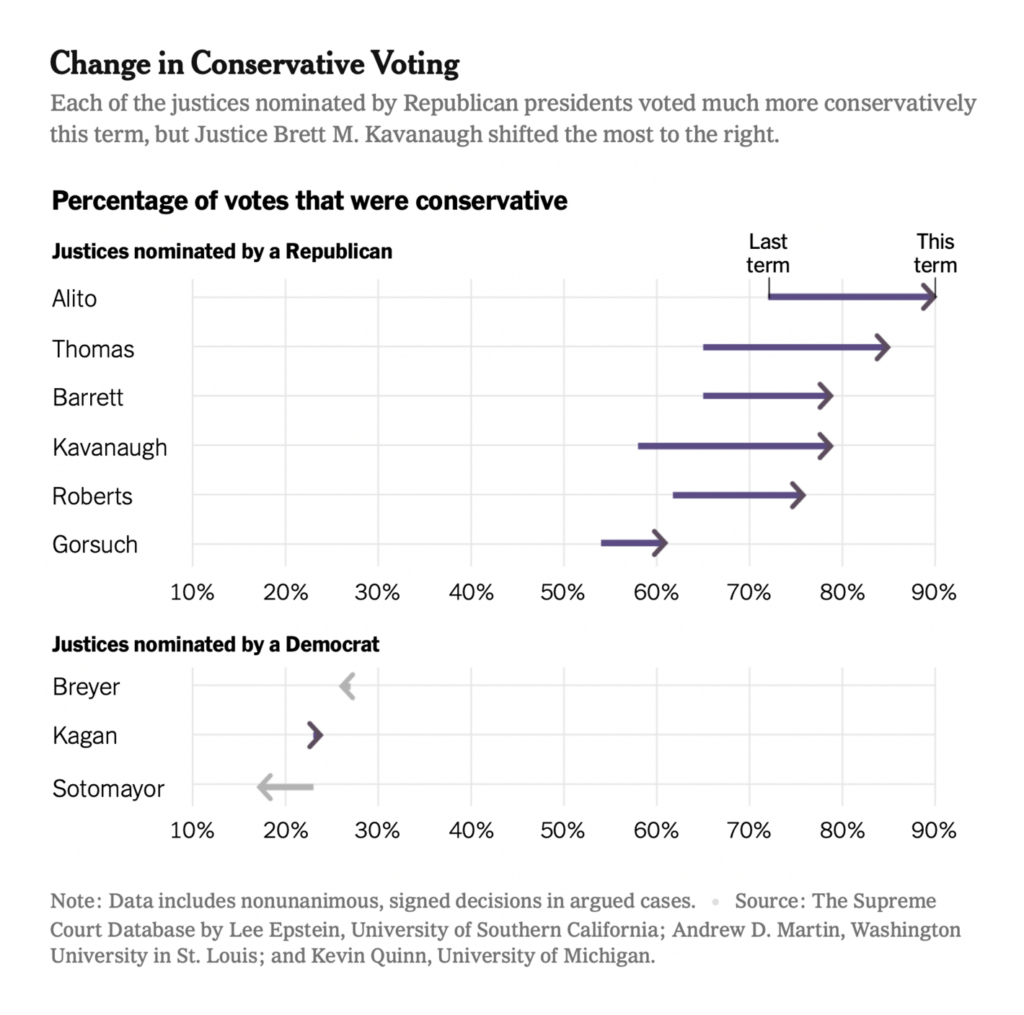
Ten days ago, the Supreme Court ruled that abortion is not constitutionally protected by a right to privacy in the United States, overturning its own precedent of 50 years and opening the door for states to ban the procedure entirely:
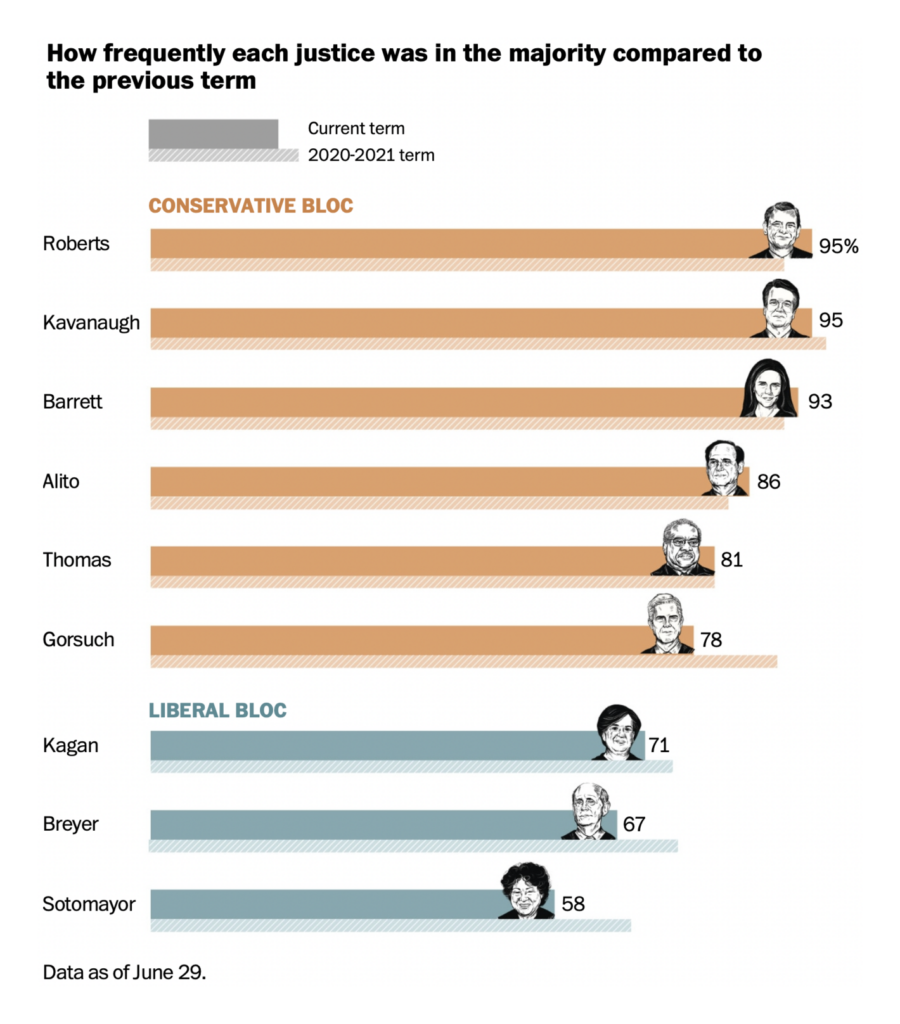
Dobbs was only one of several radical decisions this term, which also saw major right-wing rulings on environmental regulation, Native sovereignty, separation of church and state, and the ability of states to regulate handguns:
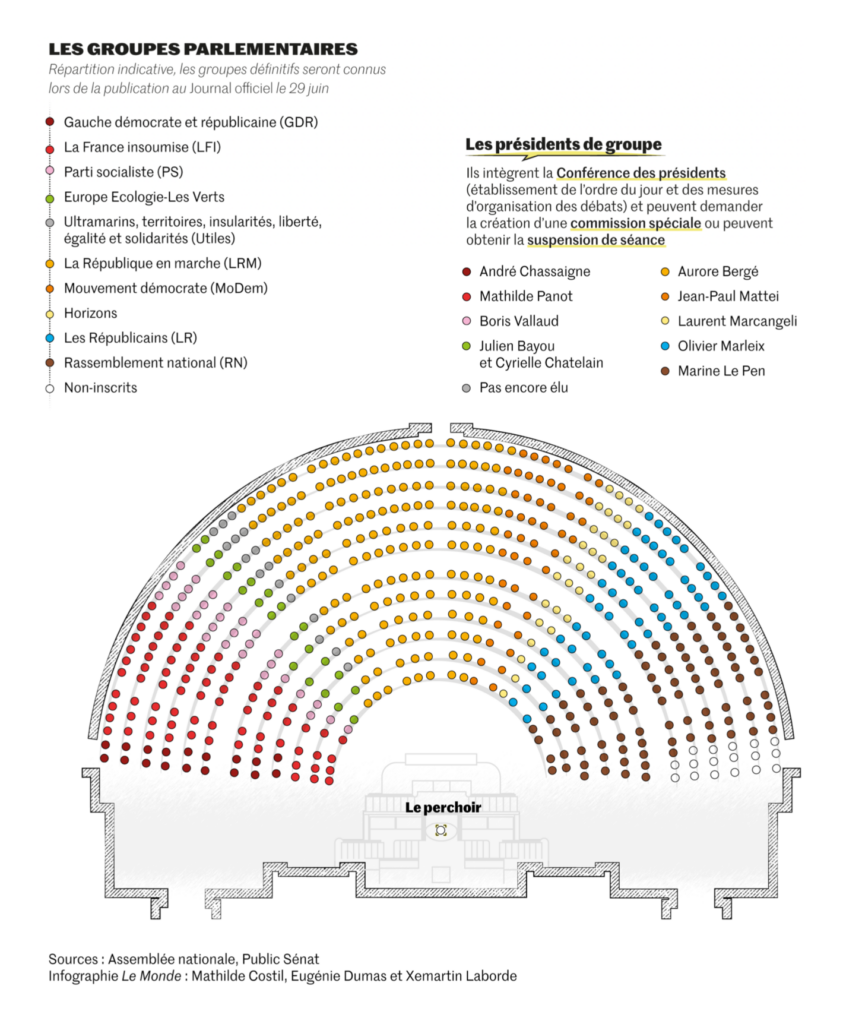
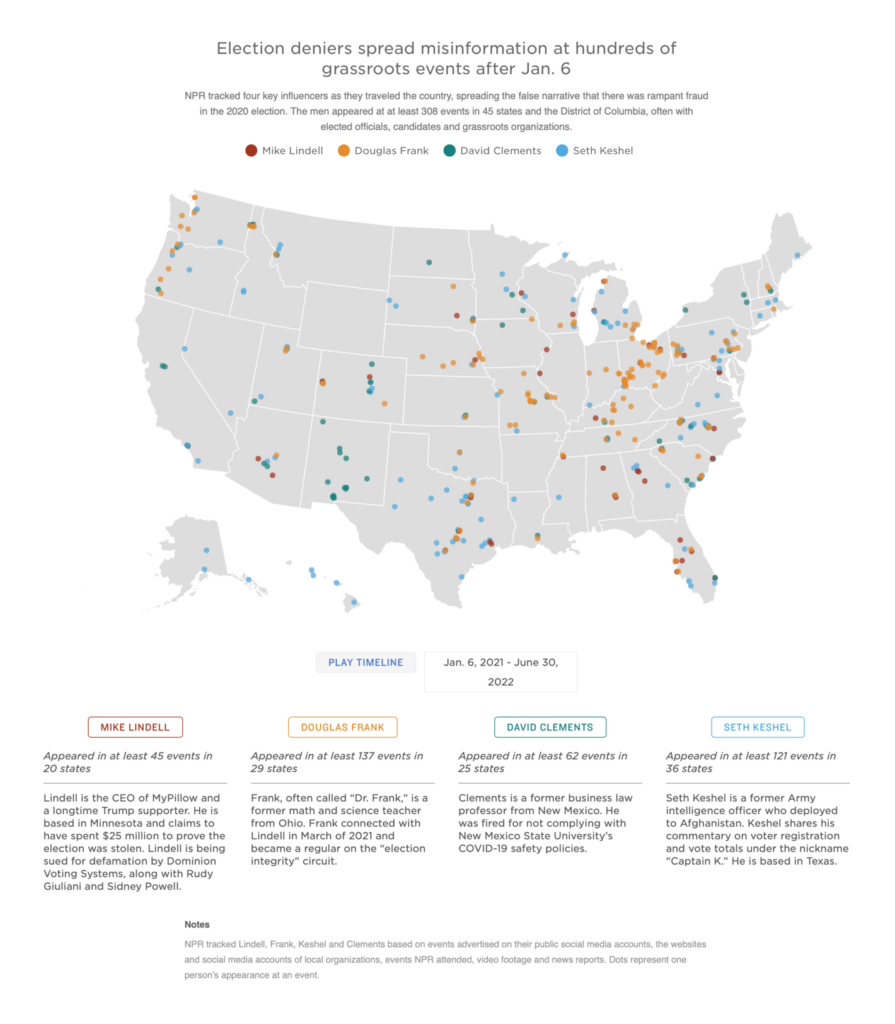
In election visualizations this week we saw the composition of a new legislature in France, and the spread of election denialism in the United States:
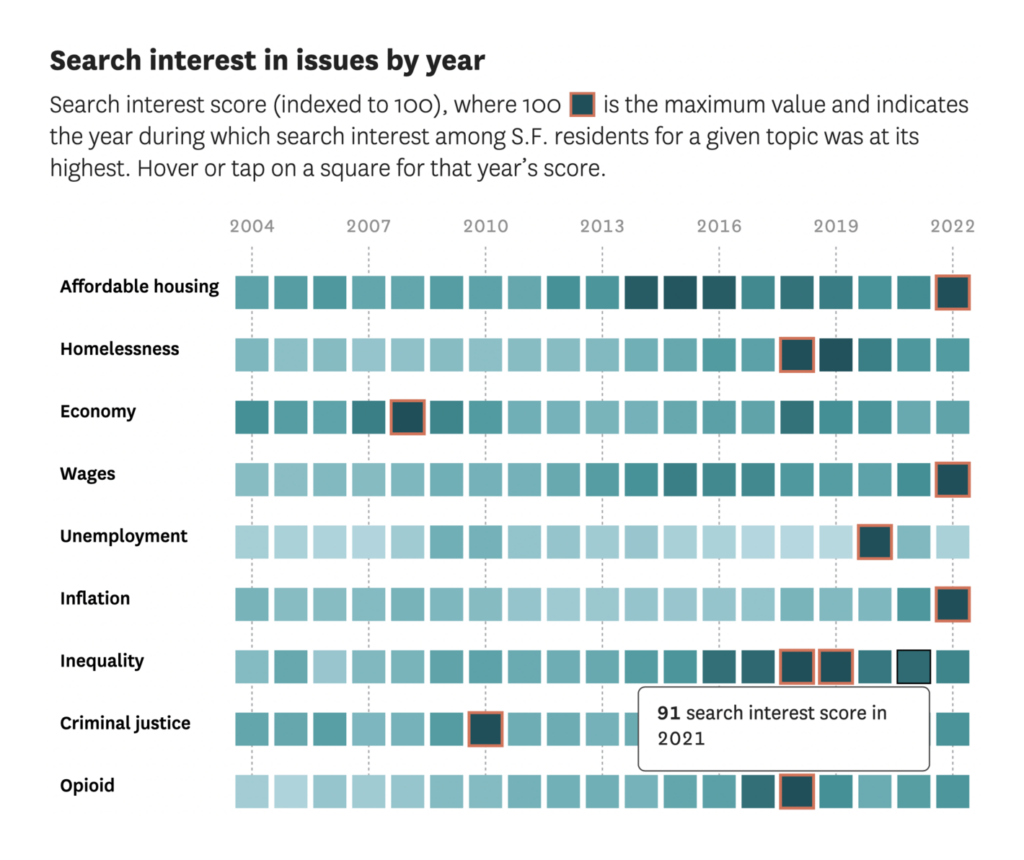
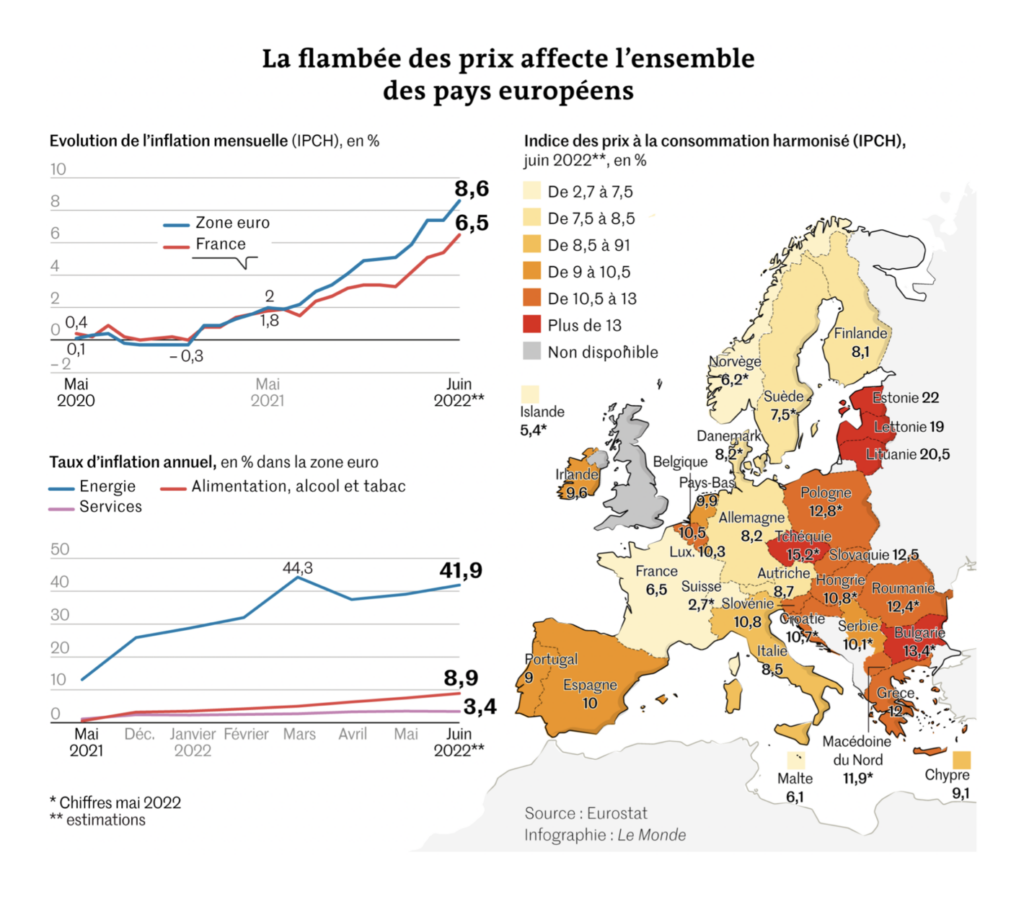
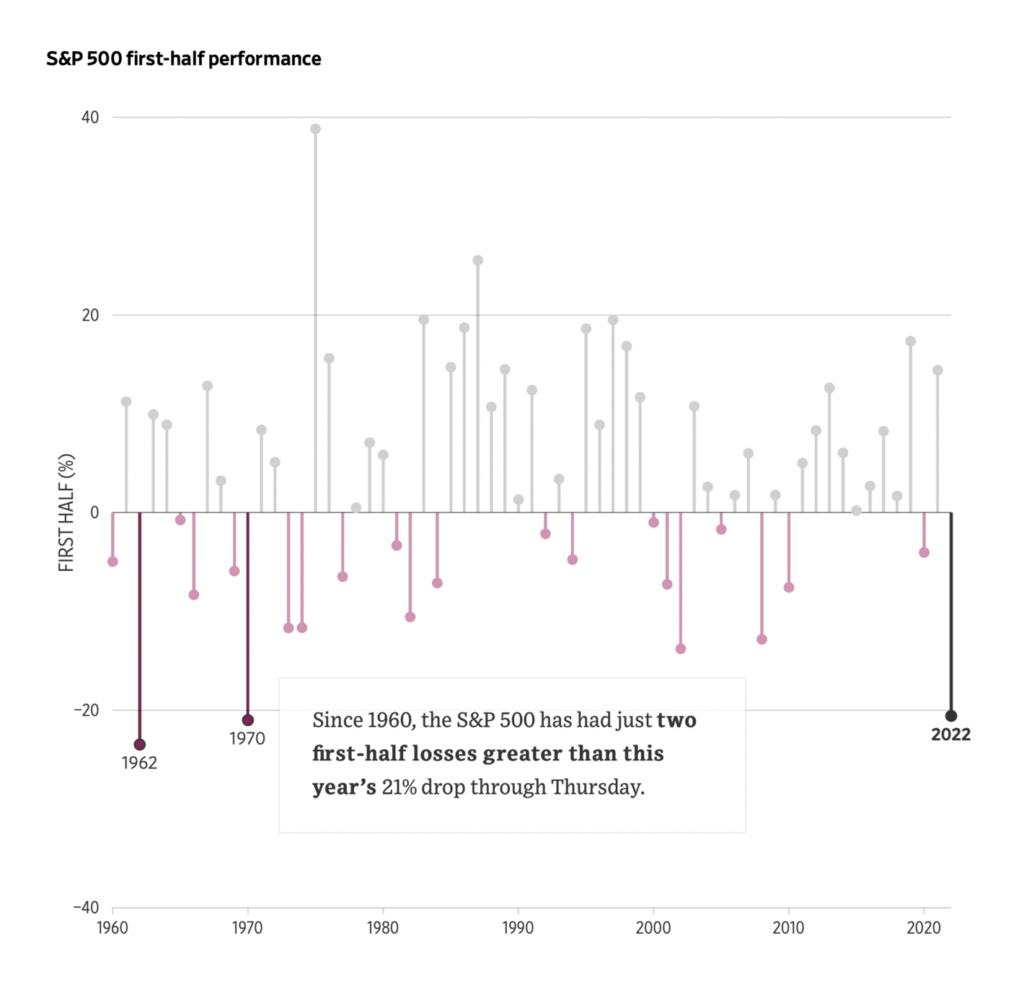
Charts on other political and economic issues included homelessness, food access, and rising prices:
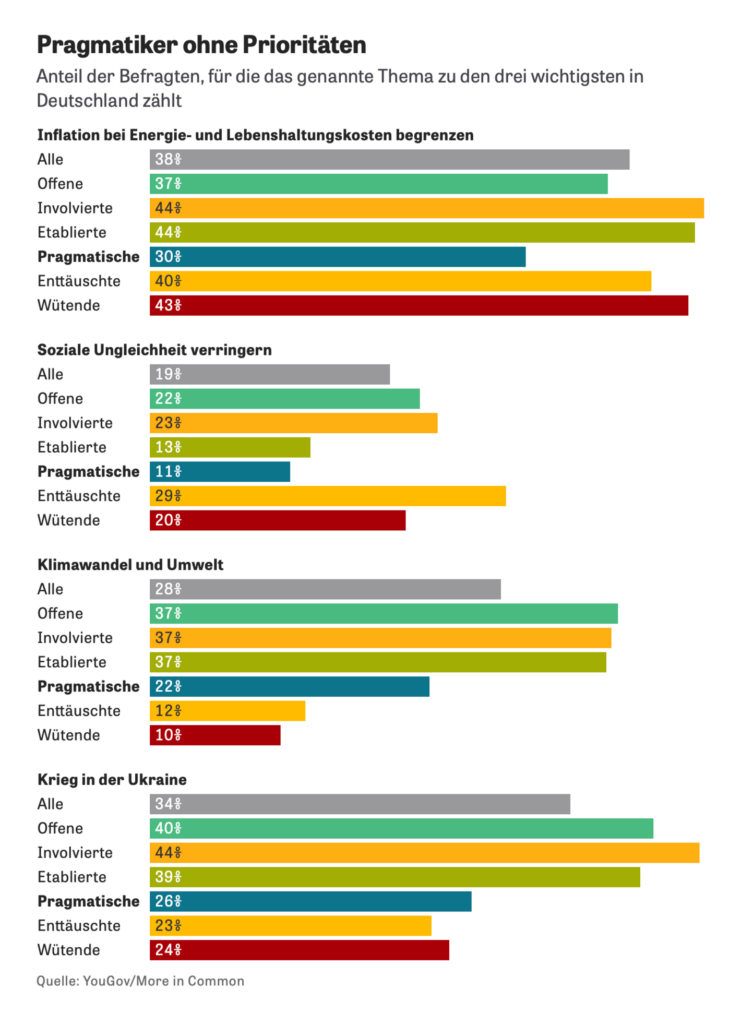
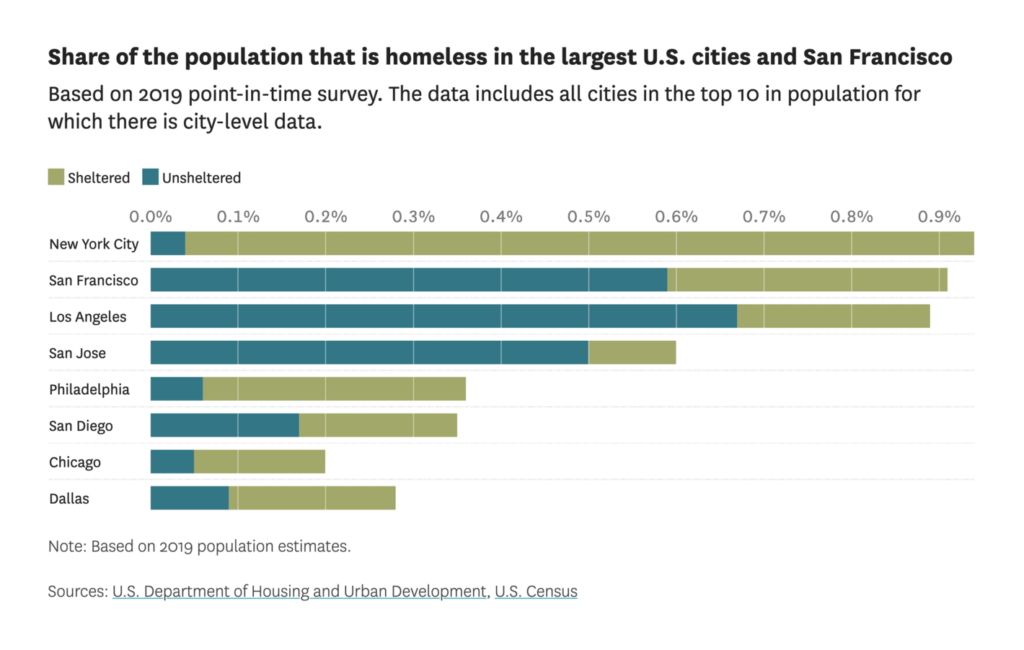
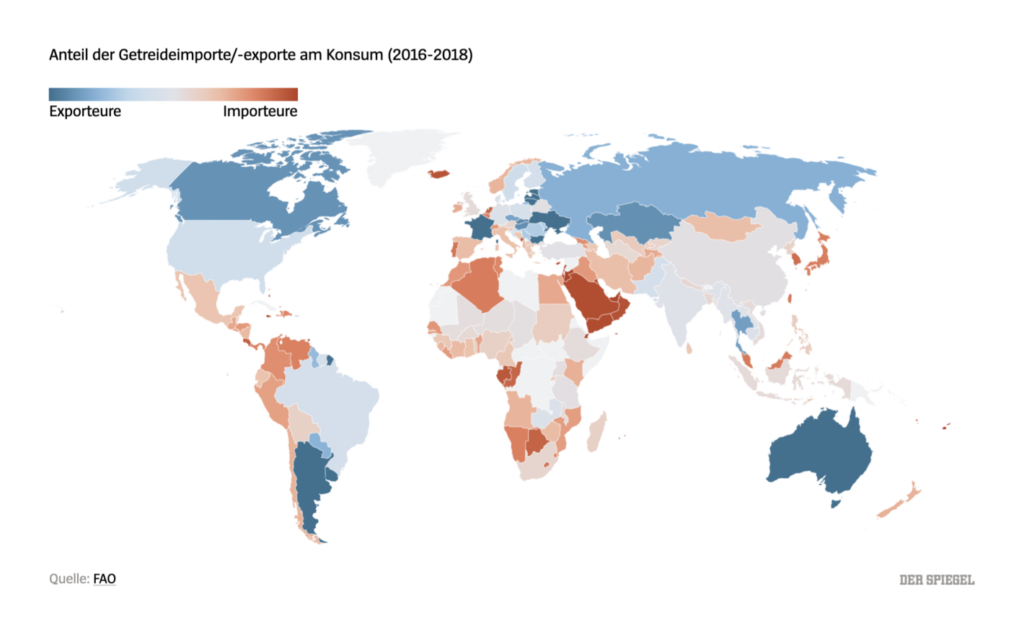
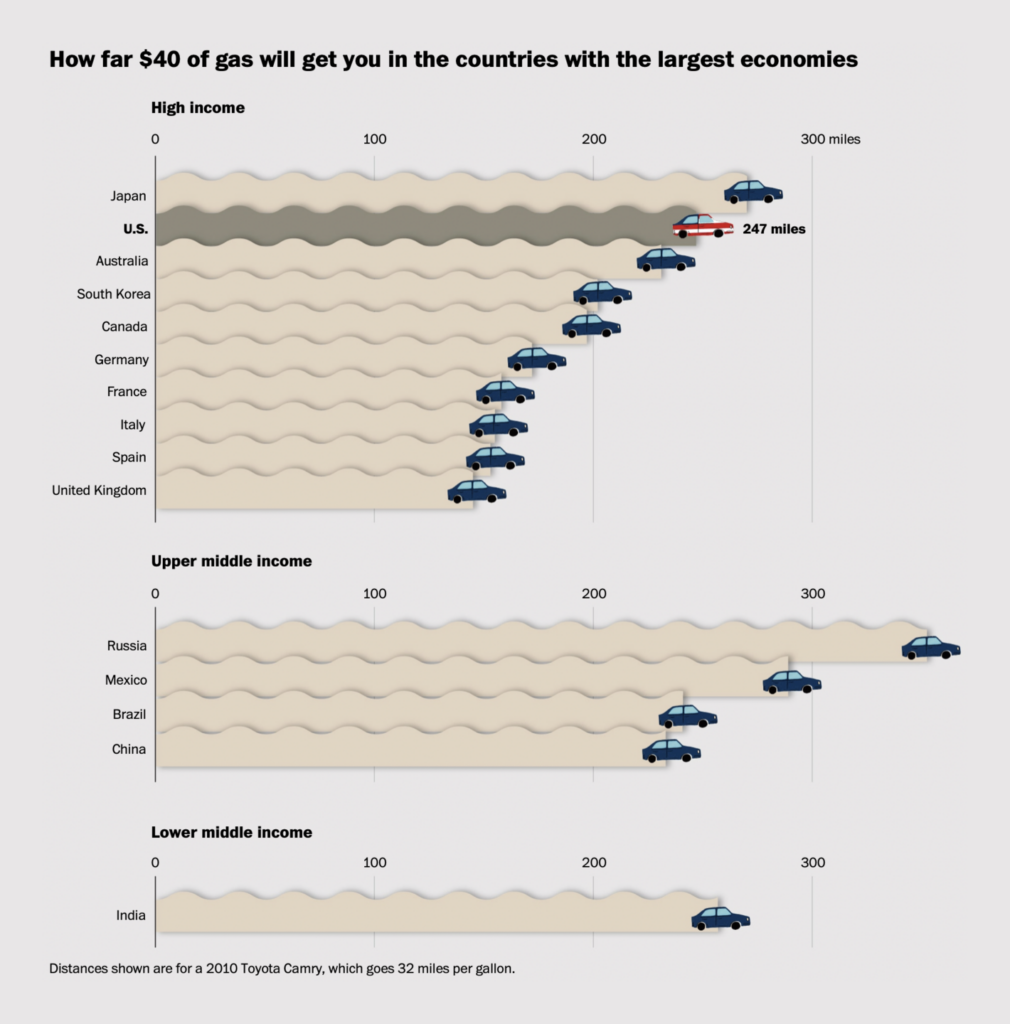
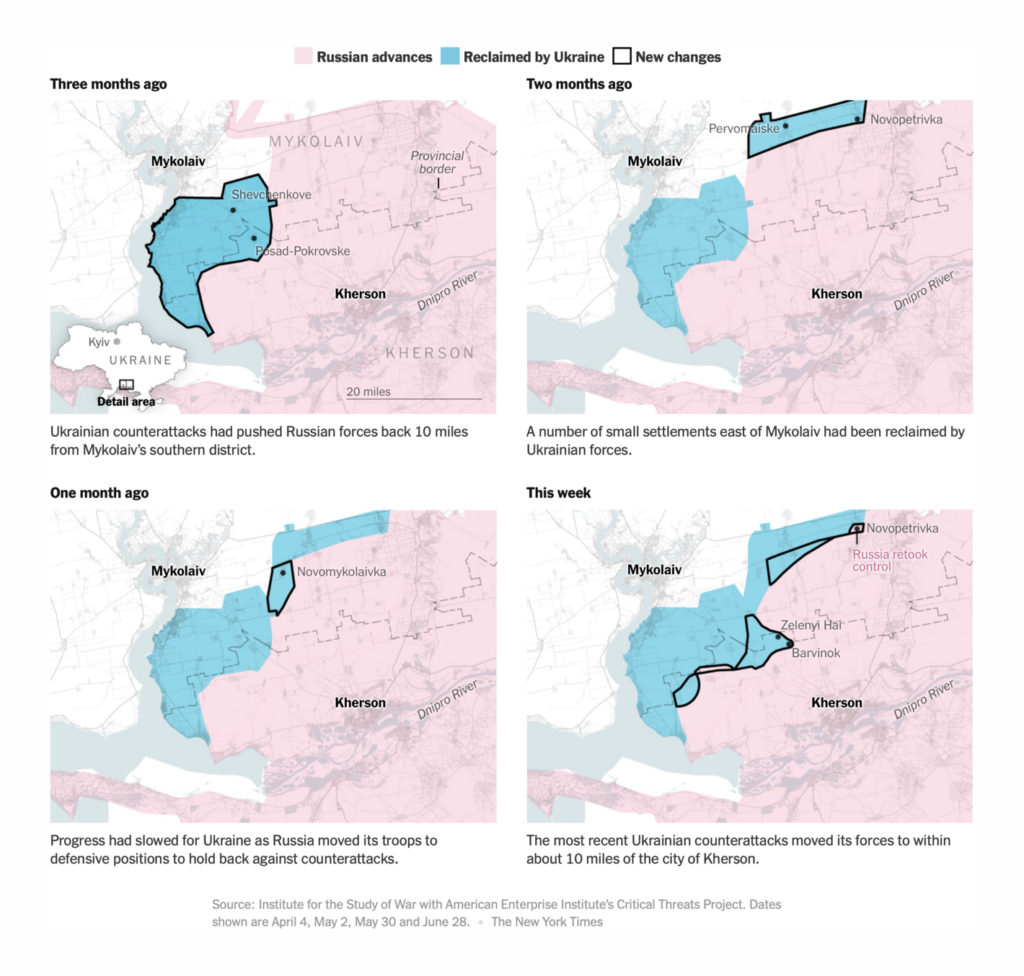
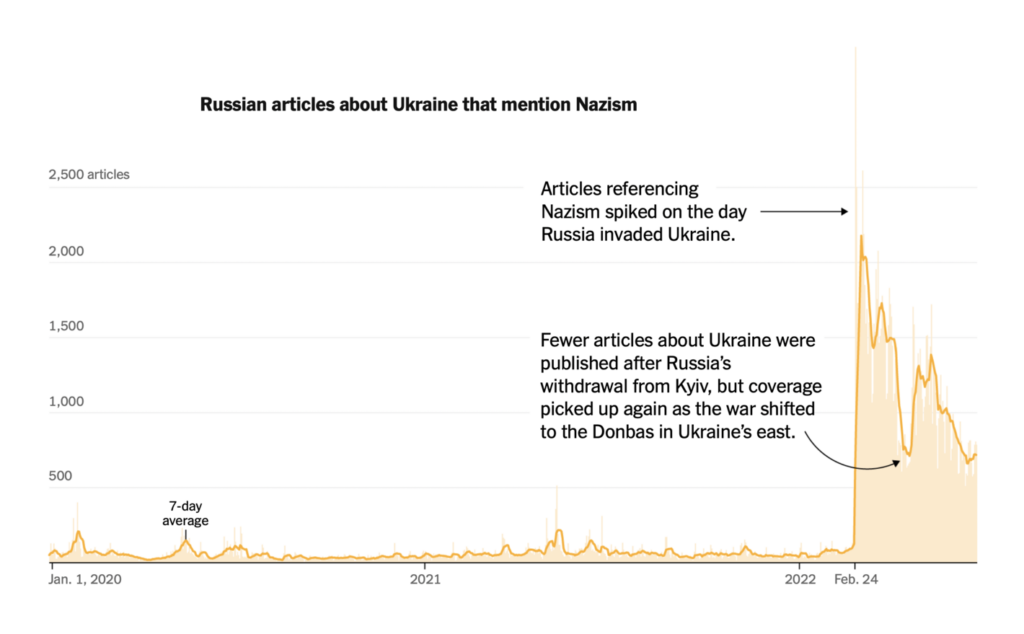
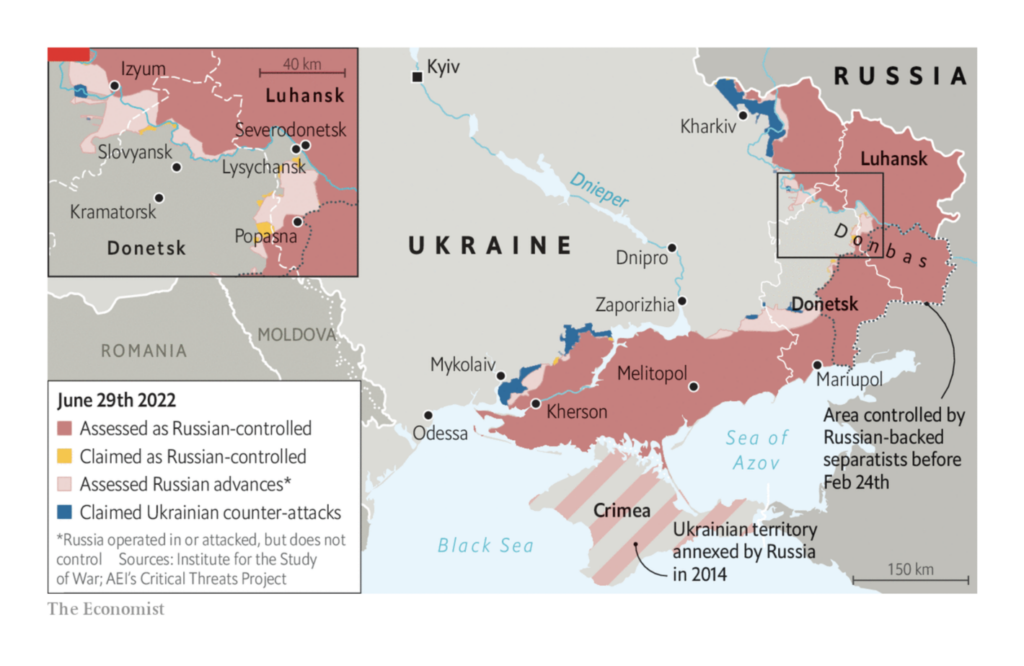
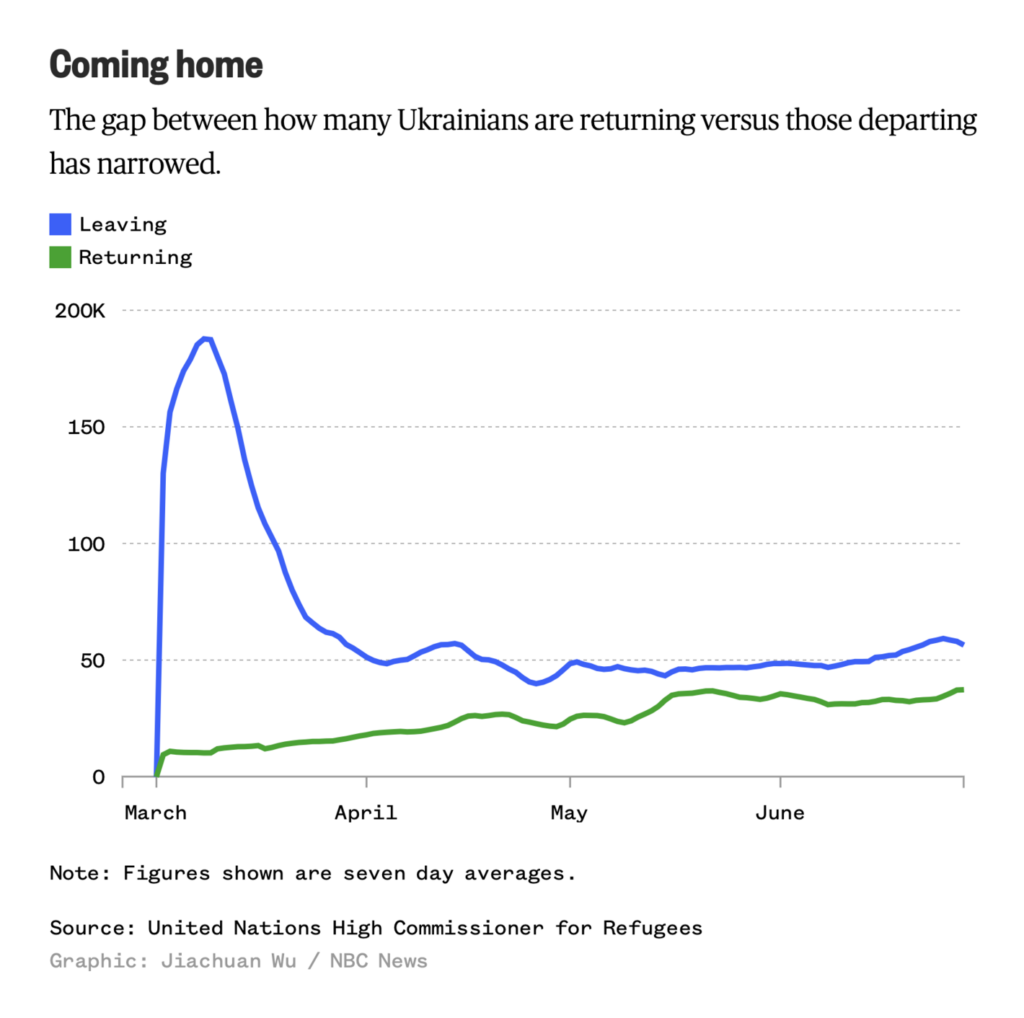
Russia’s invasion of Ukraine continues — and both strategists and civilians are starting to consider what a long war means for them:
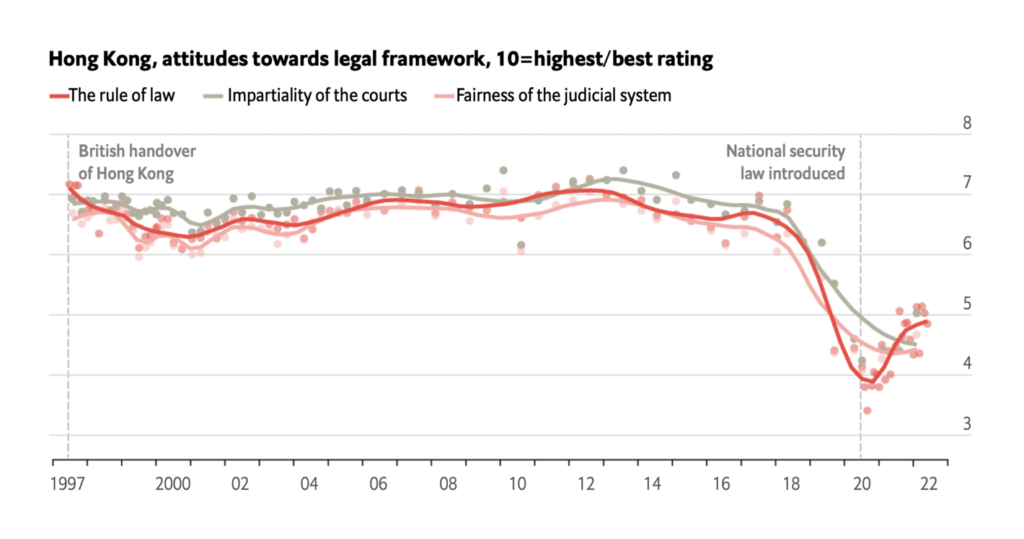
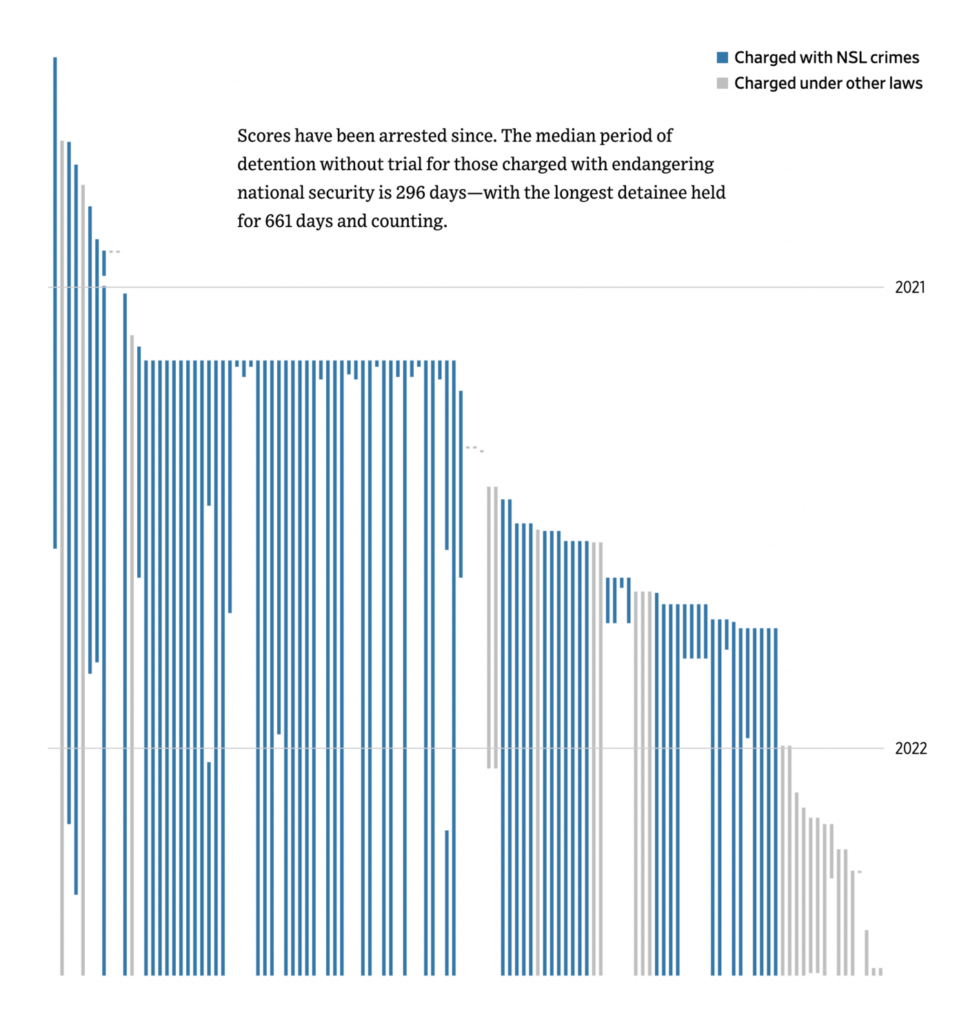
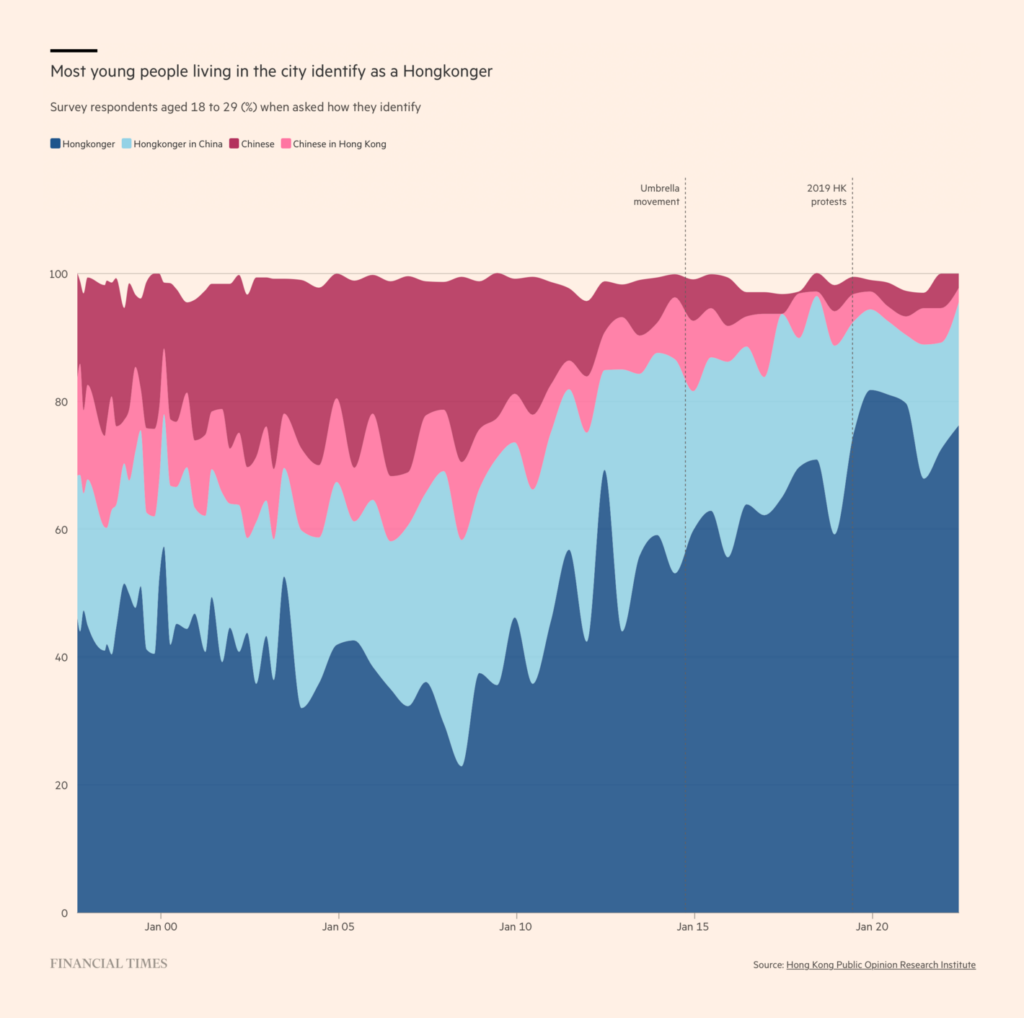
Last Friday was the anniversary of Hong Kong’s reversion to Chinese sovereignty. These charts looked back at the past 25 years, and at the current mood in the city:
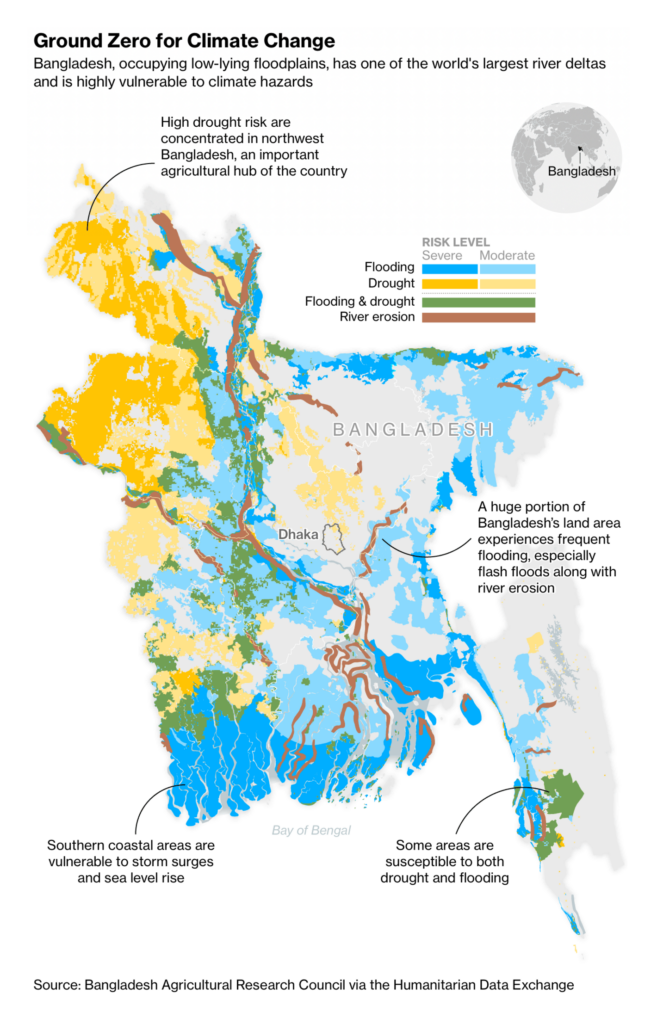
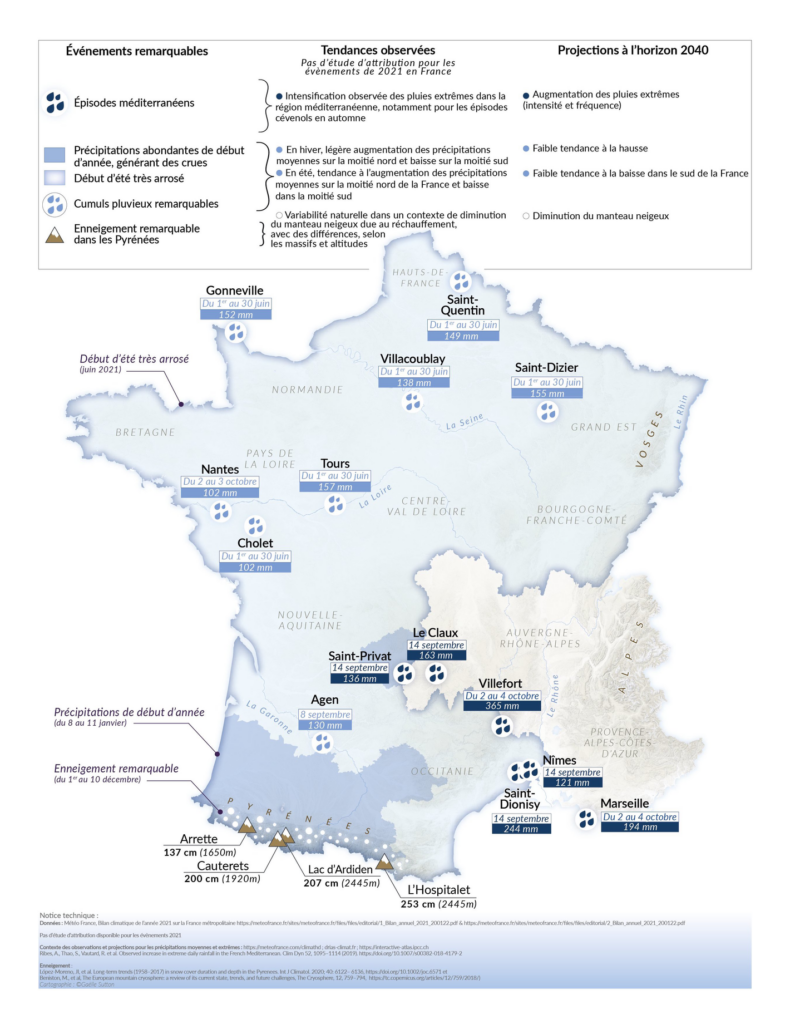
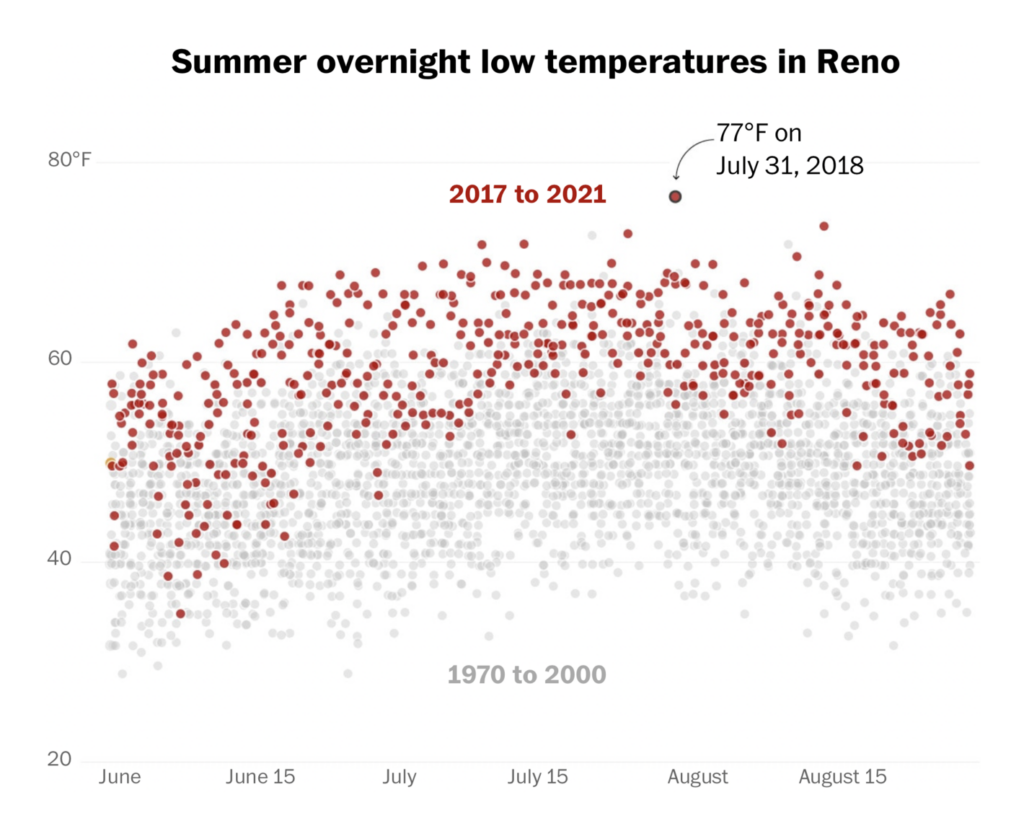
And it’s another summer of record high temperatures — with the drought, fire, and flooding they bring with them:
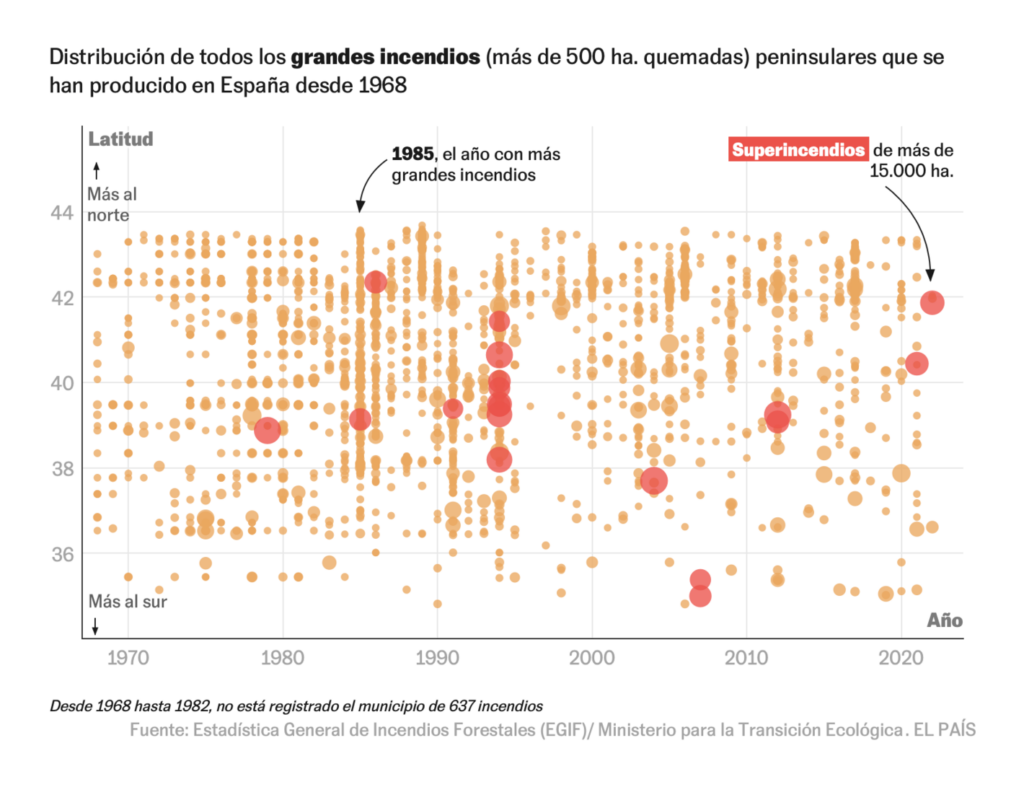
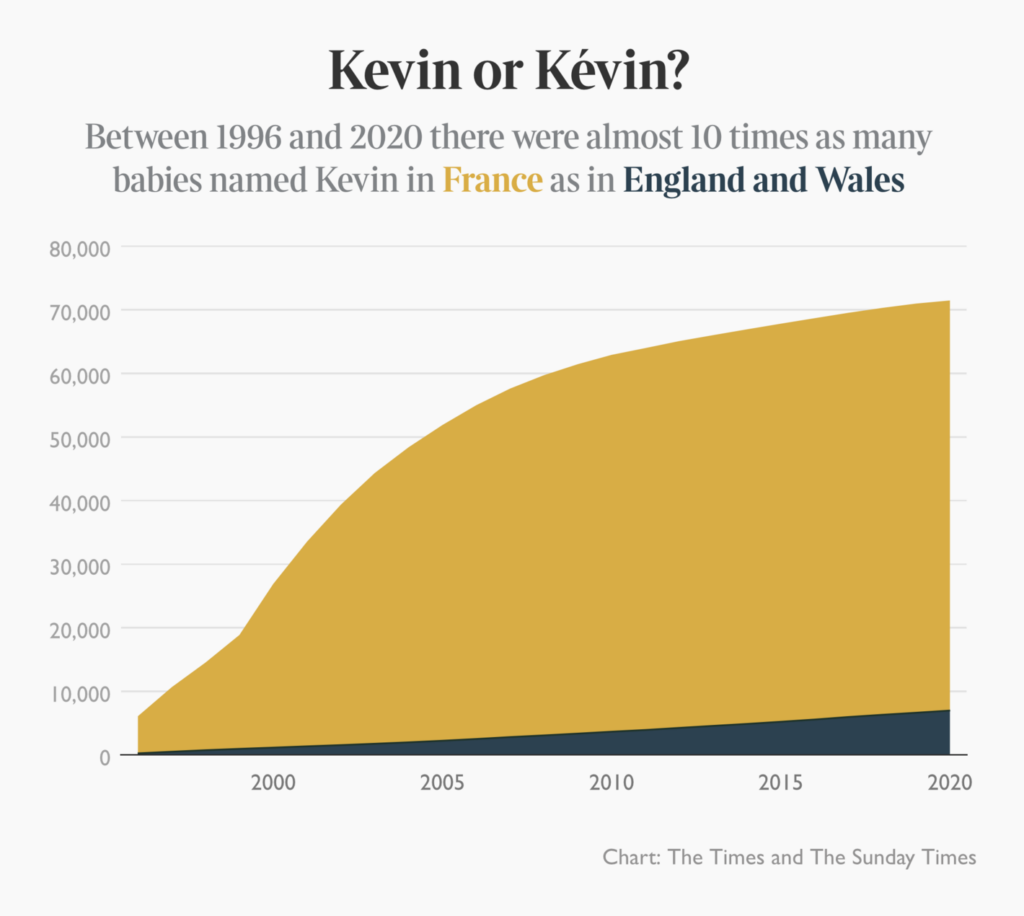
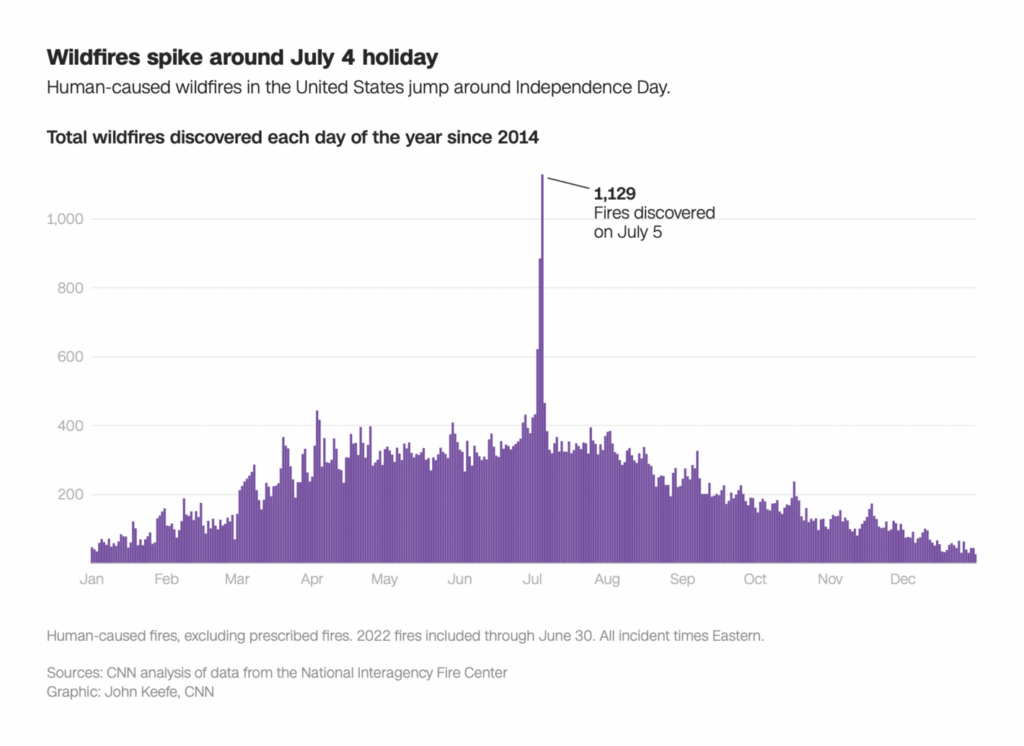
Here’s our first ever “Did You Know?” section, on baby names and wildfires:
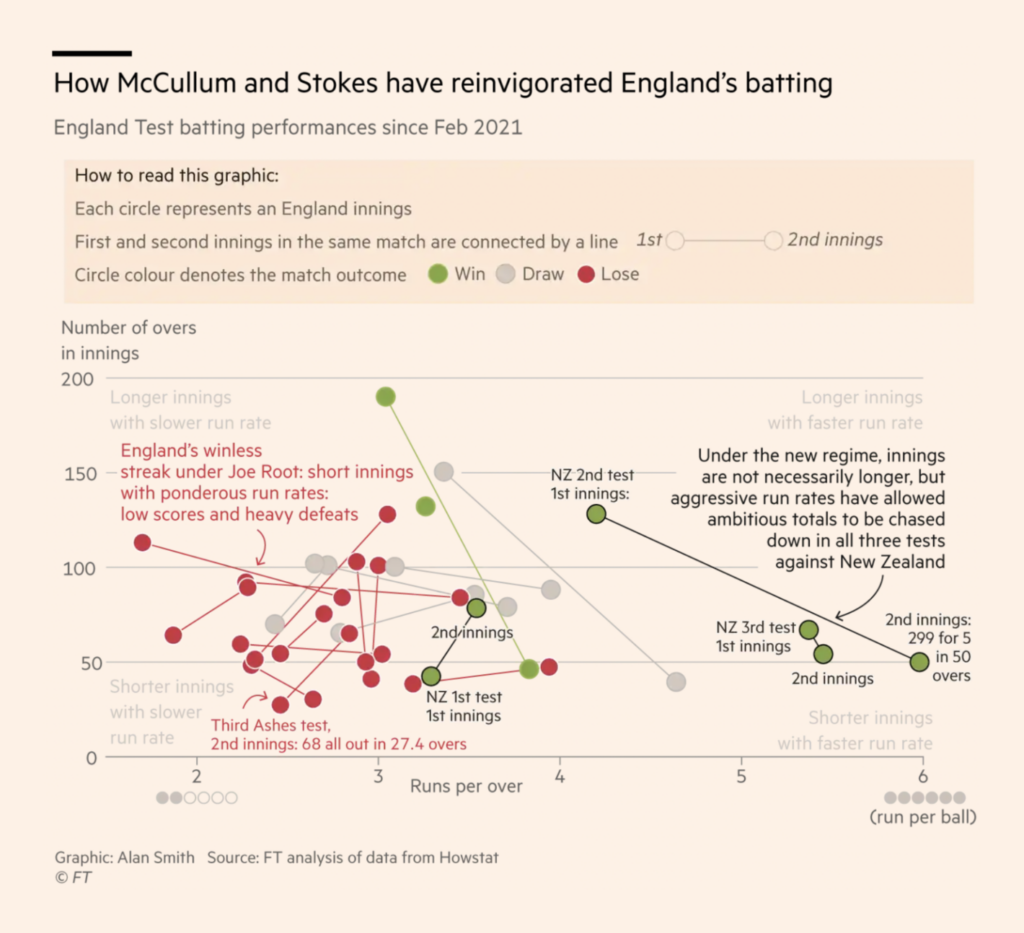
In sports — the Tour de France, water polo, and a crazy cricket chart:

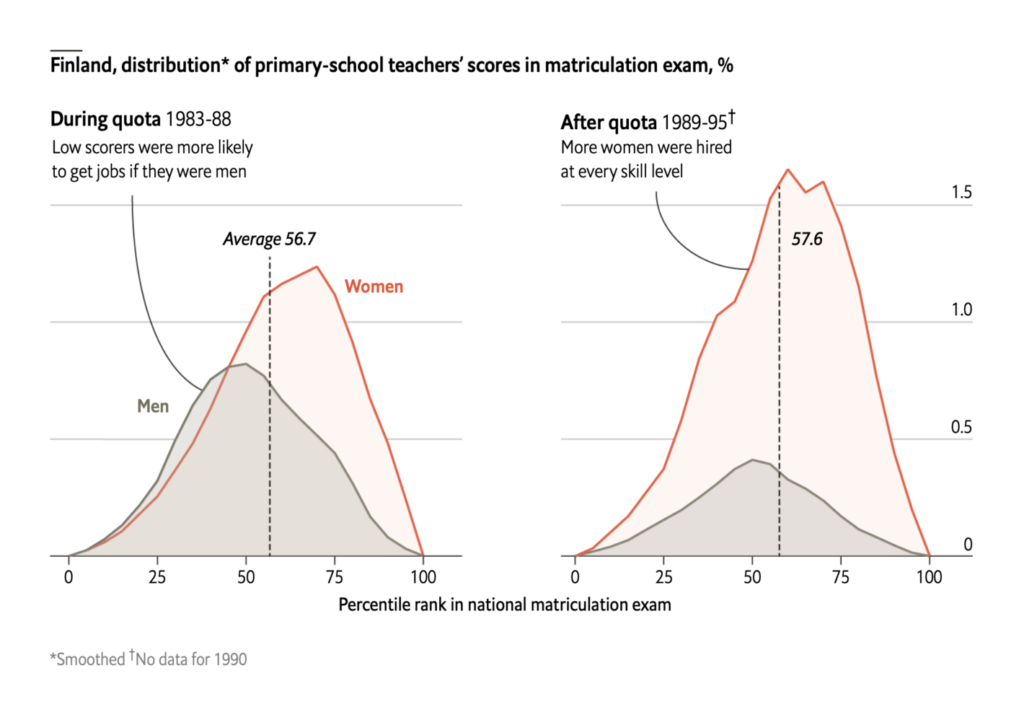
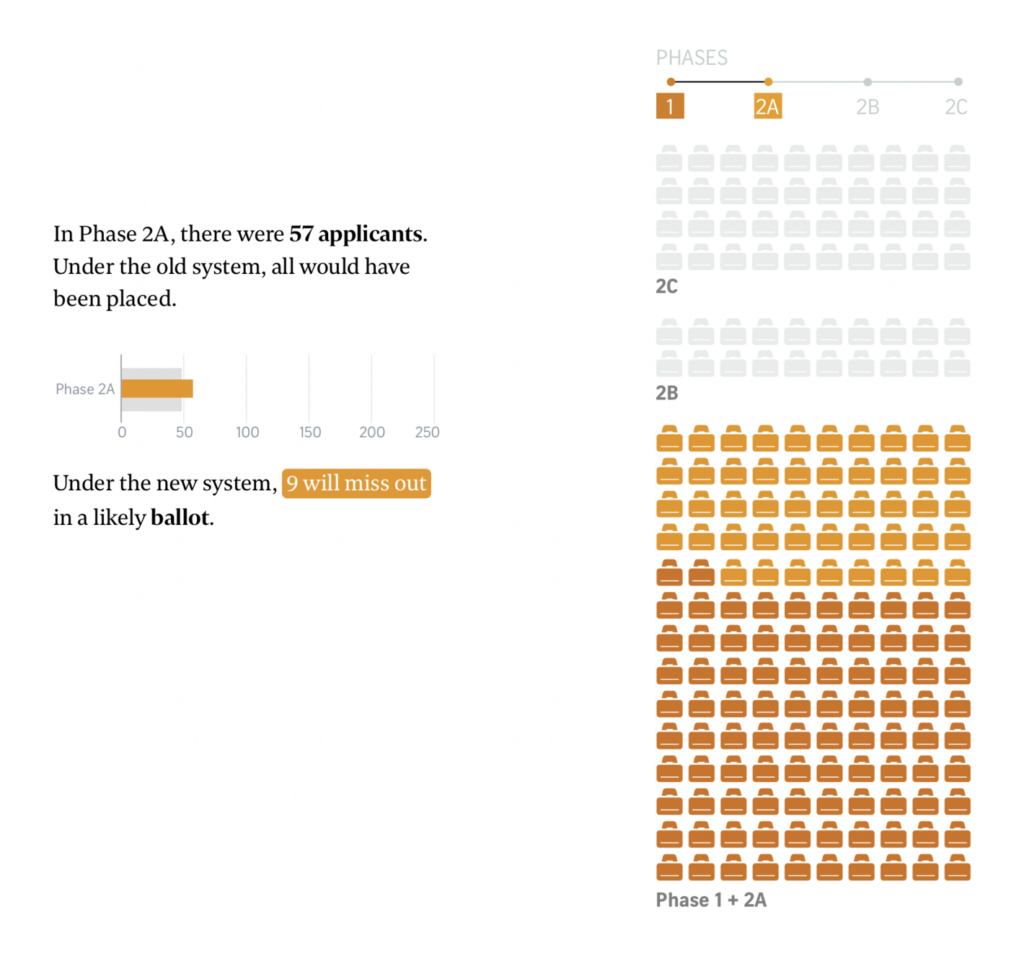
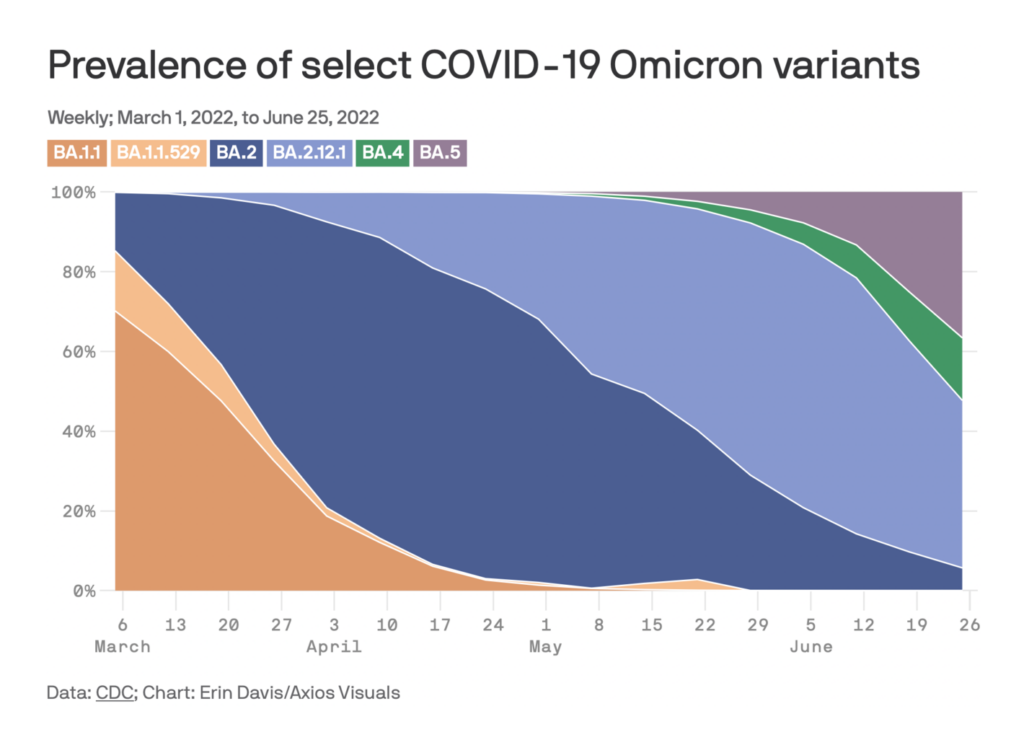
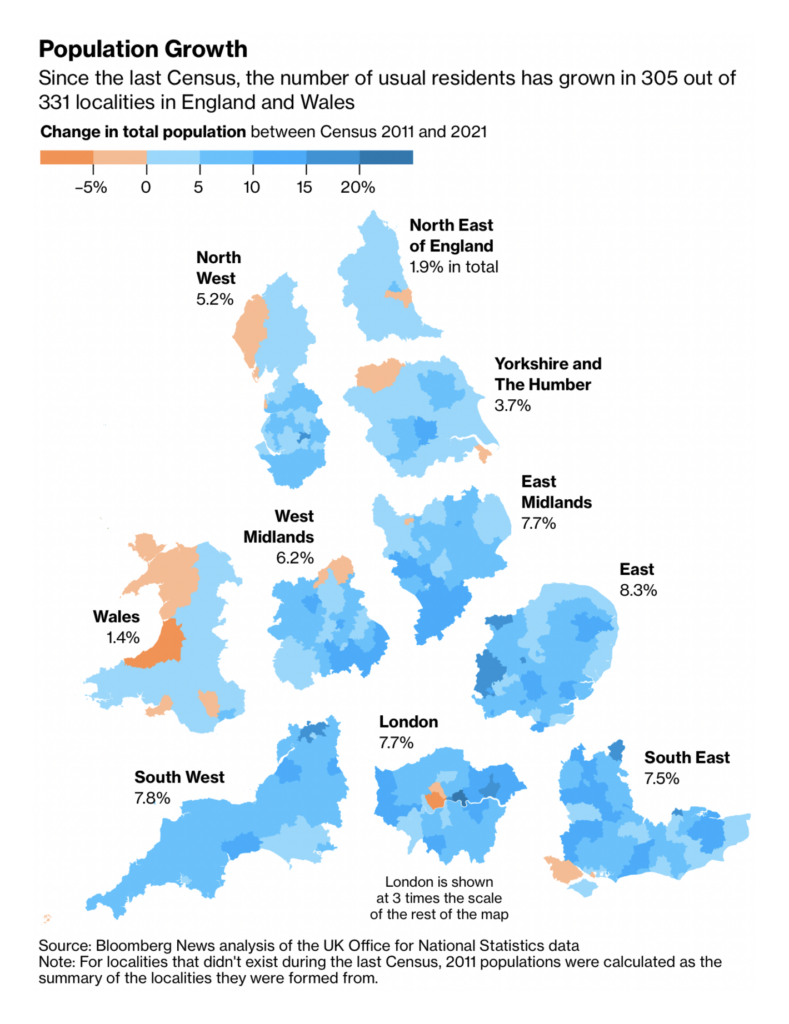
Finally, other charts and maps covered primary schooling, the pandemic, migration, and the U.K. census:


Applications are open for…
Help us make this dispatch better! We’d love to hear which newsletters, blogs, or social media accounts we need to follow to learn about interesting projects, especially from less-covered parts of the world (Asia, South America, Africa). Write us at hello@datawrapper.de or leave a comment below.
Want the Dispatch in your inbox every Tuesday? Sign up for our Blog Update newsletter!
Comments