Join our webinar to get started with Datawrapper
May 30th, 2023
2 min
Datawrapper lets you show your data as beautiful charts, maps or tables with a few clicks. Find out more about all the available visualization types.
Our mission is to help everyone communicate with data - from newsrooms to global enterprises, non-profits or public service.
We want to enable everyone to create beautiful charts, maps, and tables. New to data visualization? Or do you have specific questions about us? You'll find all the answers here.
Data vis best practices, news, and examples
100+ articles that explain how to use Datawrapper
Answers to common questions
An exchange place for Datawrapper visualizations
Workshop materials to teach Datawrapper
Learn about available positions on our team
Our latest small and big improvements
Build your integration with Datawrapper's API
We're happy to help. Get in touch with us.
This article is brought to you by Datawrapper, a data visualization tool for creating charts, maps, and tables. Learn more.
Datawrapper 1.9 is out, and here are all the big and small changes.
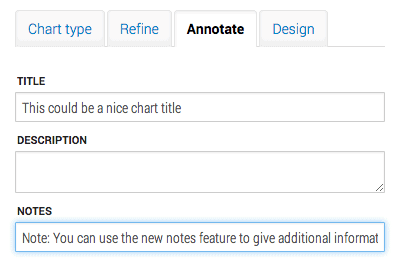
You can now add notes below your charts. This can be useful to explain details about the chart or the dataset that don’t fit into the chart intro text.
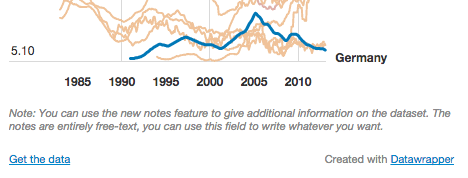
This is how the notes are displayed in the charts:
Comments