


New: Stay organized with a more powerful, faster visualization archive
June 25th, 2024
3 min
This article is brought to you by Datawrapper, a data visualization tool for creating charts, maps, and tables. Learn more.
Create simple (or complex!) visualization presets for your data.
If you’re running a website that hosts data and you want to allow your users to easily create a Datawrapper visualization, we have good news for you: Starting today, you can create visualization presets that let you feed data and visualization settings into Datawrapper.
That’s as simple or complex as you need it to be: You can let your data store visitors open your data in Datawrapper and let them decide on a chart type and all other chart settings – or you define which title, description, chart type, colors, etc. the visualization will have when it opens in Datawrapper.
This feature is completely free – you don’t even need to be a Datawrapper user to provide this new option on your website.
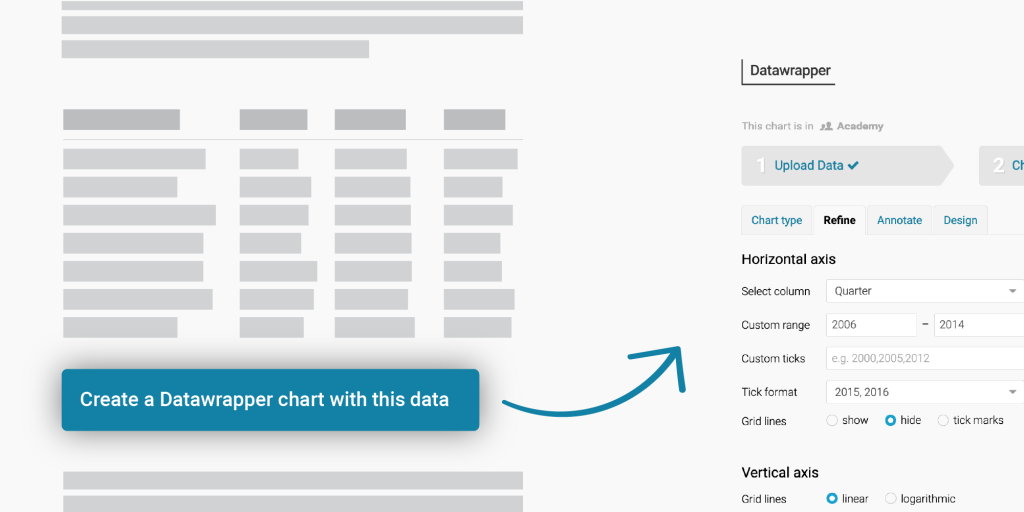
Once implemented, your visitors will see a button that invites them to create a Datawrapper chart, map, or table with the data you show on your page (e.g. “Create a Datawrapper chart with this data”).
Once clicked, your visitors will be sent to a page that lets them confirm your suggested visualization settings, title, notes, etc. (if you defined them). It will also show your visitors the data set again:
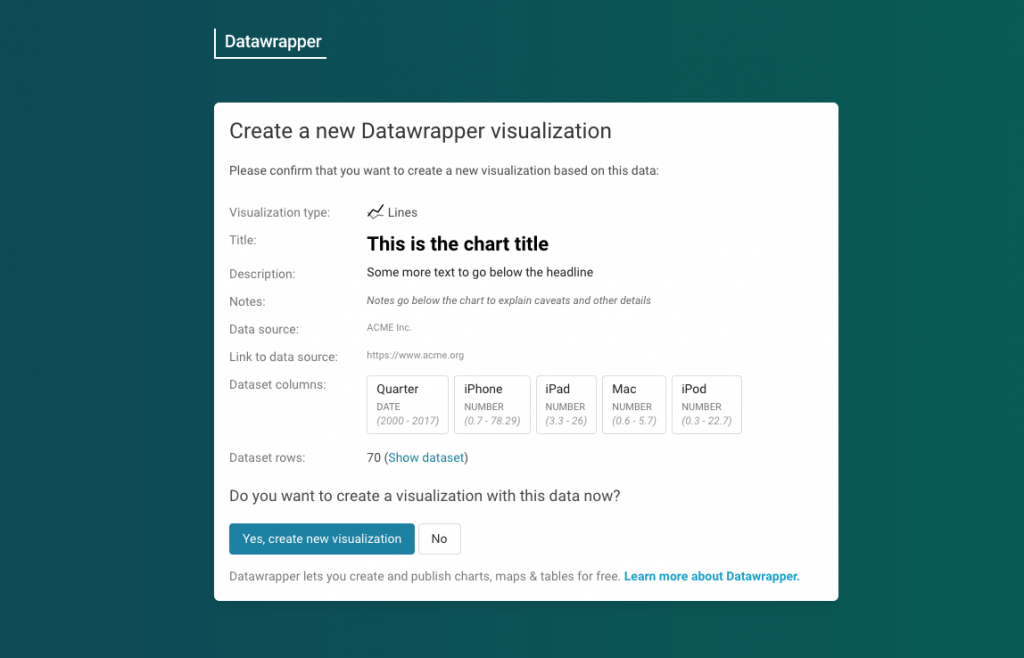
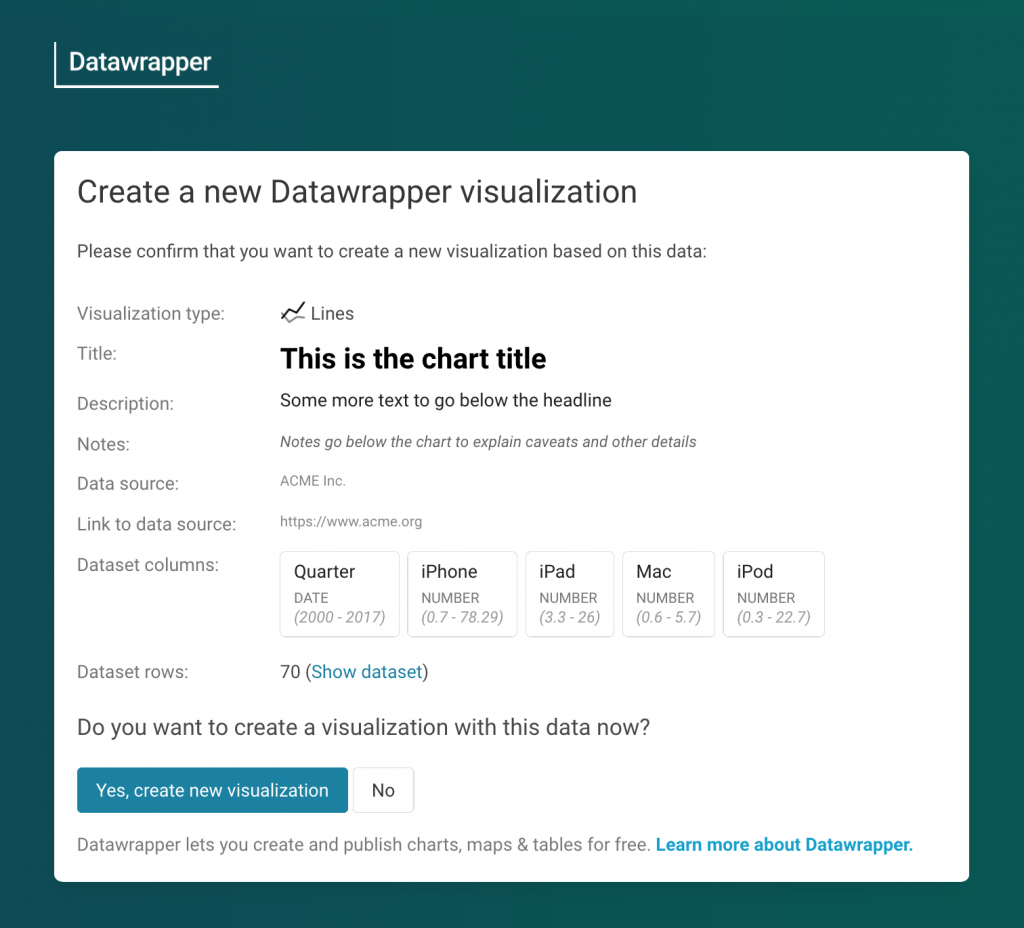
They can then click on “Yes, create new visualization” to land directly in step 3: Visualize of the Datawrapper app.
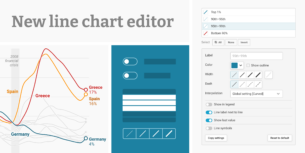
Your visitors will be able to change all your suggested visualization settings, like the title or chart type. They can also go back to step 1: Upload data or step 2: Check & Describe to change the data.
If they’re logged into Datawrapper, the visualization gets created in the visitor’s default team and can simply be published in step 4: Publish. If they’re not Datawrapper users yet, they can sign up and create a Datawrapper account in that final step.
The “Create a Datawrapper chart with this data” button on your website is actually an HTML form that you pre-fill with the data, visualization settings, title, source, etc.
There are many ways to create a form. We prepared a demo of a JavaScript version and a simple HTML form. Here’s a step by step guide:
method is POST. The action needs to be https://app.datawrapper.de/create/.type to hidden .<input type="submit" value="Create visualization" />And that’s it! To learn more about how to create HTML forms, we recommend this Mozilla article.
Here’s an example of such an HTML form:
<form method="POST" target="_blank" action="<https://app.datawrapper.de/create/>">
    <input type="text" name="type" value="d3-lines" />
    <input name="title" type="text" value="This is the chart title" />
    <input name="description" type="text" value="Some more text to go below the headline" />
    <input name="source_name" type="text" value="Apple" />
    <input type="submit" value="Create a Datawrapper chart with this data" />
    <textarea name="data">Quarter;iPhone;iPad;Mac;iPod
Q3 2000;;;1.1;
Q4 2000;;;0.6;
Q1 2001;;;0.7;
Q2 2001;;;0.8;
    </textarea>
</form>
You can decide how many visualization settings you want to add to your form. If you don’t set the title as an input, it also won’t appear on the confirmation page. (You can also set more advanced metadata settings like the color of your bars that also won’t appear on the confirmation page.) And if you have a datastore/data hub with thousands of data sets, simply set a generic “Open this Datawrapper” button that sends people to step 2: Check & Describe in Datawrapper.
For more information, visit our developer docs. They explain in detail how you can
We’re planning to work on a more convenient user-facing “Edit in Datawrapper” feature, which will be more similar to the “Edit this chart” button we have for Datawrapper visualizations on our blog. (Here’s an example: Hover over it, and the button will appear in the top-right.)
An option like this will make it easier to allow re-using existing (published) visualizations as a template.
As always, we’d love to hear from you. What will you use this new feature for? Which option(s) are you missing? Let us know at support@datawrapper.de. And to get started, visit our dedicated “visualization presets” how-to in our developer docs.
Comments