

Join our webinars: Getting started with Datawrapper, and a Maps Deep Dive
June 20th, 2023
3 min
We’re happy to welcome Edurne Morillo to the Datawrapper support team.

Yes, we have another person join our team: We’re excited to welcome Edurne (Eddie) Morillo as our support engineer. Like our last support engineer hire Aya, Eddie works five days a week, answering your questions and making sure you get the most out of Datawrapper.
Before July, she was a support intern at Datawrapper for a few months – so you might already know her from your questions to support@datawrapper.de. And if you’re following this blog, you’ve probably read two (!) of Eddie’s Weekly Charts: One that explores “Are peaceful protests more successful than violent ones?” and a second one in which she tries to convince Aya to become vegetarian.
We asked Eddie some questions to get to know her better:
Hi there! I was born in Madrid, but in the last few years, I’ve lived in many different places. At the moment, I’m based between Spain and Switzerland. I like traveling, analog and digital photography, and cinema (I have a soft spot for animated films).
“Some pictures from the last film roll I got developed”
Growing up, I devoured many books and films and I wrote short novels and recorded interviews (featuring my family and dog). This naturally led me to study Journalism and Film in Spain.
After completing my bachelor’s degree in 2017, I moved to Tokyo. There, I worked as a journalist for Agencia EFE, the biggest news agency in Spanish. A year later I moved to Nairobi, Kenya, and became a foreign correspondent for EFE.
I discovered my passion for data journalism while living in Kenya. Taking a leap of faith, I quit my job and decided to go back to university. Last September, thanks to a fellowship, I started a Master of Science in Computational and Data Journalism at Cardiff University in Wales. One of the modules I studied was data visualization – and I fell in love with it!
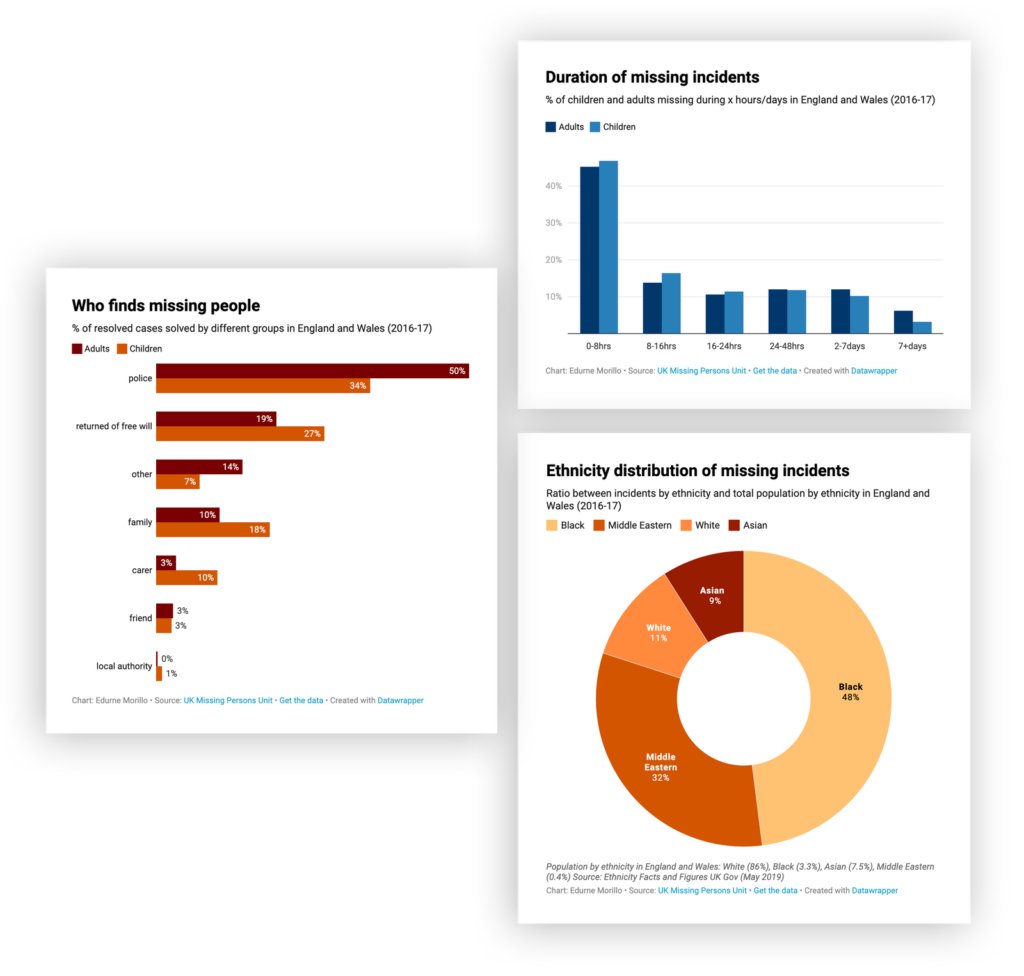
“In Aidan’s and Martin’s course about ‘Digital Investigation’, we used Datawrapper for a data journalism project called ‘Missing Tracks’: An investigation of reasons and stories behind people going missing in the UK.”
Datawrapper was the first data visualization tool I ever used. During my master’s it was my go-to tool for any projects I had. Then I started following the Datawrapper blog and reading the Weekly Charts. I was eager to learn more about data vis and I started to look for internships in this field. One of my teachers sent me the link to this position at Datawrapper. That you’re reading this article means that everything went well: I’m now part of this amazing team.
I’m joining the team as a support engineer. This is a cool way of saying that I’m helping all of you on the other side of support@datawrapper.de. You can reach out to us with any questions you may have about the tool and we’ll be happy to help. You don’t know how this feature works? Reach out! You’d like some guidance in choosing a chart type? Reach out as well! All questions are valid and welcome.
Since I speak Spanish and French, questions in those languages are also more than welcome. (Please, bear with me if my French is not perfect!)
When I was working as a journalist, I sometimes felt unmotivated. I loved my job, but I thought I was not learning enough or exploring the medium to its maximum. Then someone told me: “You should learn Python”. Of course, I didn’t know what Python was (apart from a type of snake, I love snakes!). After some research, I joined an intensive online course where I learned about variables, loops, classes, and a massive list of other cool terms.
However, there was a problem: I had no use for my newly acquired Python knowledge. That was until I joined my master’s. There I learned how to connect journalism, data, and programming. Thanks to my teacher Aidan O’Donnell (the same one that pointed me to this job!), I learned how to find stories in data and how to be accurate when working with numbers. Martin Chorley introduced me to the world of D3.js and was an excellent guide for web development. He also inspired me to create my first personal website.

“Once Martin made us draw the WORST visualization ever. Here’s our attempt.”
In the last few months at Datawrapper, I’ve already learned many things about data visualization while improving my communication skills and upgrading my technical knowledge. My colleagues are always happy to show me the way around things. I’m grateful for that.
In the future, I’d love to learn more about D3, Python, JavaScript, and scrollytelling. And I want to learn more about data visualization design. That’s why starting this September, I’ll attend a postgraduate course on Data Visualization at an online university in Spain.
On a completely unrelated note, I’d also like to get my hands on pottery this coming year (a long-time dream of mine).
Thanks for answering all our questions, Eddie! It’s great to know you as part of our team. If you, dear reader, want to learn more about Eddie, make sure to follow her on Twitter: @EdurneMG, or visit her website: edurnemg.github.io.


Comments