

Join our webinars: Getting started with Datawrapper, and a Maps Deep Dive
June 20th, 2023
3 min
We’re thrilled to introduce you all to yet another new addition to the Datawrapper team: Simon Jockers. He will work for three days a week as a software engineer. As such, he will help to build the next version of the Datawrapper chart editor and will also work on the chart types that users can create with Datawrapper.
I asked Simon some questions so that we can all get to know him:
Hi! I am a web developer and (occasional) data journalist with an academic background in media technology and computer science. Outside of my day-to-day work, I help organize community events around open technology and journalism topics, such as the Hacks/Hackers Berlin meetup.
I have worked as a web developer for more than twelve years and have focused on civic tech and data journalism projects for the past five. My last real job was at the German non-profit newsroom CORRECTIV, where I developed newsroom tools, contributed to data reporting, and helped to build a small technology and data team within the newsroom.
I am also a co-founder and the project lead of Datenguide, an open data initiative that aims to make German official statistics more accessible for journalists. With Datenguide, I recently went through the Mozilla Open Leaders program, which is an excellent training and mentorship program for people who work in open technology projects.
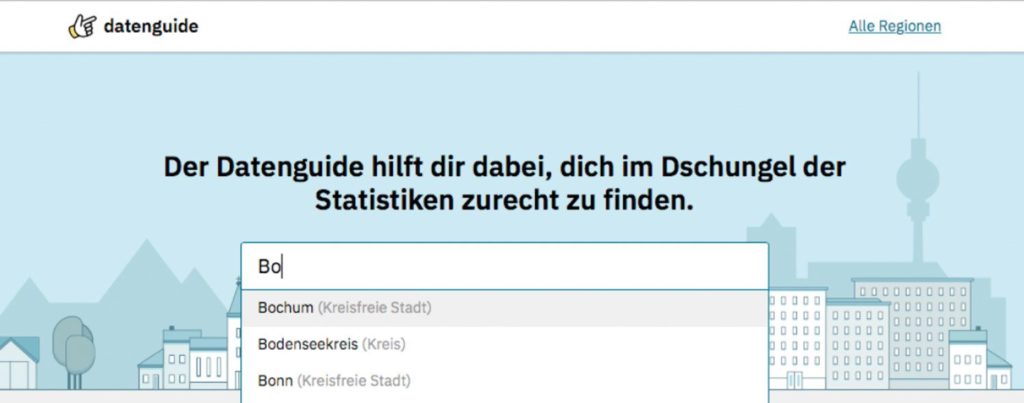
Simon’s Datenguide project
I have also been involved with community-supported agriculture (CSA) for many years and have recently helped to relaunch ernte-teilen.org, a web app that brings together farmers and consumers in CSA initiatives.
I first got interested in data visualization during my Bachelor studies, when one of Edward Tufte’s books was part of the reading list for a visual design class I was taking. Shortly afterward I started working in web design and development.
Some of my first jobs were building interactive infographics and charts – this was around 2007 and people used Flash for this kind of work.”
Some of my first jobs were building interactive infographics and charts – this was around 2007 and people used Flash for this kind of work. A couple of years after that I got involved with the German open data and civic tech scene and finally moved into data journalism when I joined CORRECTIV in 2014.
Datawrapper makes an important contribution to the data journalism community by helping journalists around the world to publish their data reporting. It enables them to create maps and charts without having to worry about the design and technology underneath. For me, joining Datawrapper is a logical next step in my journey to make better data journalism tools. It is also the opportunity to work with some of the brightest people in data visualization today.
We’re super happy to welcome Simon on board. If you want to find out more about him, visit his personal website simonjockers.de, find him on Twitter (@sjockers), Github (@sjockers) or the Mastodon instance vis.social (again, @sjockers).


Comments