Join our webinars: Getting started with Datawrapper, and a Maps Deep Dive
June 20th, 2023
3 min

As mentioned when we introduced you to Elliot the other day, we hired quite a few people in the last week (and are very excited about that!). One of them is Lucas “Doce” Fernandes (he/him or they/them), who joins our development team as a full-time full-stack developer with a front-end focus.
We asked a few questions to get to know Doce better:
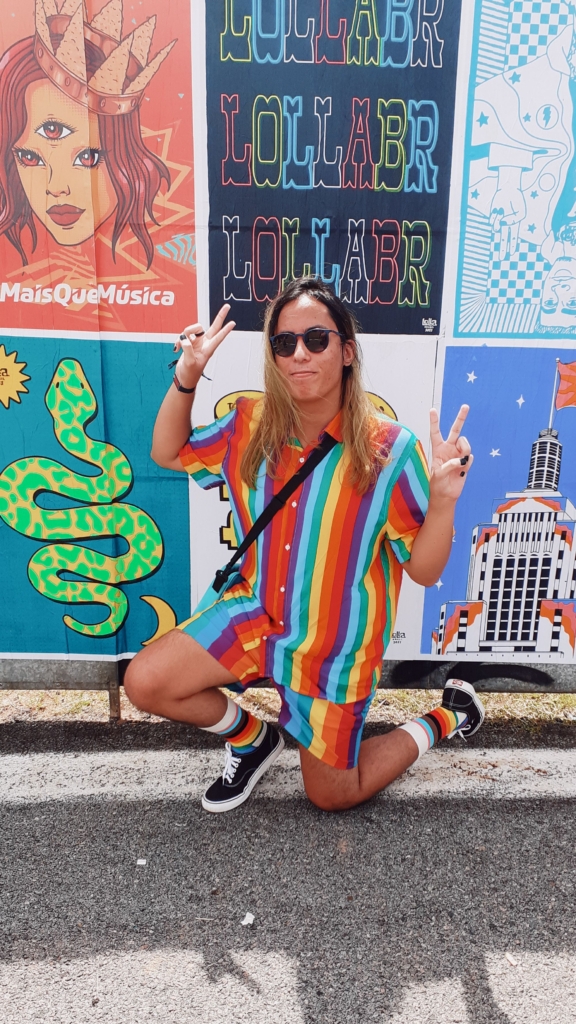
Hi, call me Doce[1]! I’m from Minas Gerais, Brazil. I’ve been working as a developer since 2018, but I’ve been coding at least since 2015. I love trying new technology and finding interesting ways to use it (I signed up for my first email address at 5 years old). I’m always looking at mundane things from a technical perspective.
I really enjoy coding, and I love to do it live! So three times a week you will always find me live streaming my coding sessions while chatting with cool people online. This is a nice way to share what I’m currently doing/learning, meet new people and always have someone to debug my code with me. It also works as a boost of motivation to keep working on my personal projects.

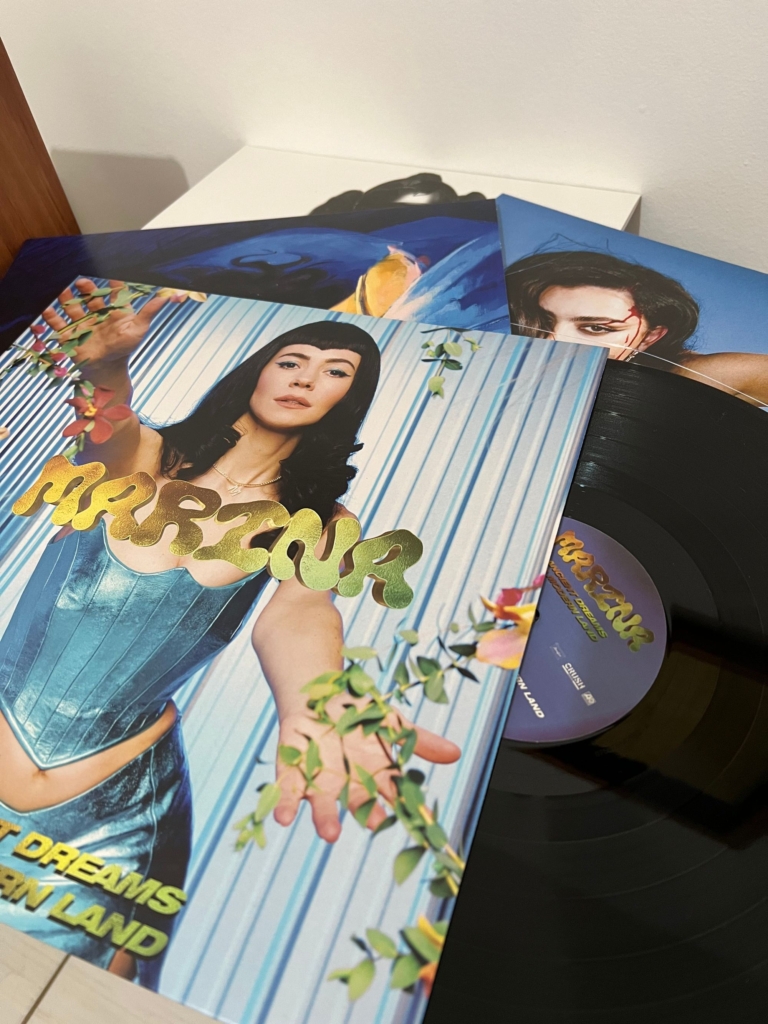
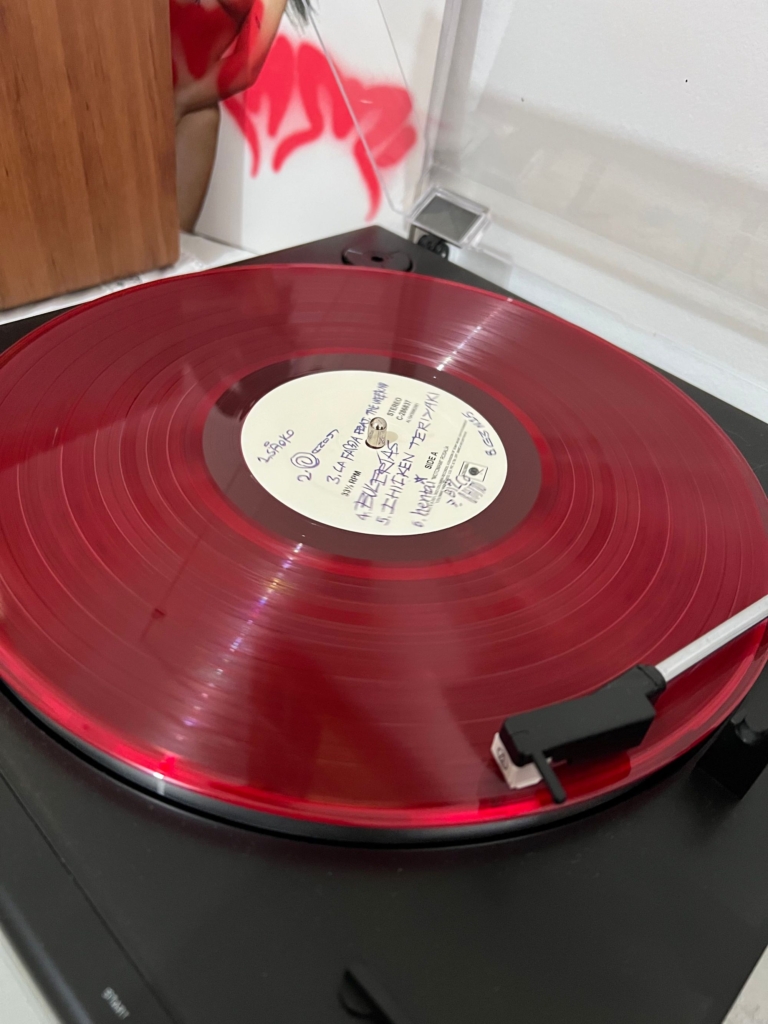
Offline, I love spending some quality time with my friends and listening to music. I’m the type of person that loves to get cozy and listen through an entire album, without skipping or interruptions. It makes sense that one of my recent hobbies has been collecting vinyl records.
I wanted to join Datawrapper because it seemed like a really cool company with a really cool product that is doing a lot of interesting things with data visualization, which is a brand new area to me and that’s always very exciting. I also really like Svelte, which is a library that Datawrapper uses on their tech stack.
I will be joining the product team, so I’m one of the people responsible for developing and maintaining the Datawrapper application, ensuring that all features are working properly and that everything is visually appealing. In addition, I will also work on creating new user-facing features and improving existing ones.
The idea of working in a quite small, international team where I could really get to know my colleagues also resonated with me.
Before joining Datawrapper, I worked with quite a great range of web technologies. Mostly with React for my day-to-day job and Svelte for my personal projects. In my last job at a software company here in Brazil, I was mainly implementing new features for a client’s sales platform.

At the same time, I’ve also been maintaining a few projects of mine like my own website and some other projects, mainly related to my live streams.
I never really knew anything about data visualization or data journalism until I watched the Svelte Origins documentary that was released in June this year. I was really impressed by how this piece of technology was originally made to solve problems that journalists and developers face when creating highly interactive experiences, like charts. After that, I started looking into data visualization and I've been lurking around that area ever since.
There are many things that I like about data visualization, but one of the things that I appreciate the most is the challenge of taking data and presenting it in a way that is both accurate and aesthetically pleasing. As a developer, I know how hard it can be to make visualizations accessible for everyone — and how easy and enjoyable Datawrapper makes this process to be.
Some people are really into music charts (me included 🙋). These nerdy people like to use websites to generate collages of their personal charts. This is a great way to share what you have been listening to with your friends and also find new music that your friends are into. There are lots of websites and apps that do that already, but I really wanted to make my own, designed to be dead simple to use and really easy to develop new themes.
So that’s what I did (and I’m still doing)! I named it Semaninha, “little week” in Portuguese, a reference to how people usually call these collages their “week on music”. You just need to type your Last.fm username, customize your chart and generate it. In the end, you will have something looking like one of these:
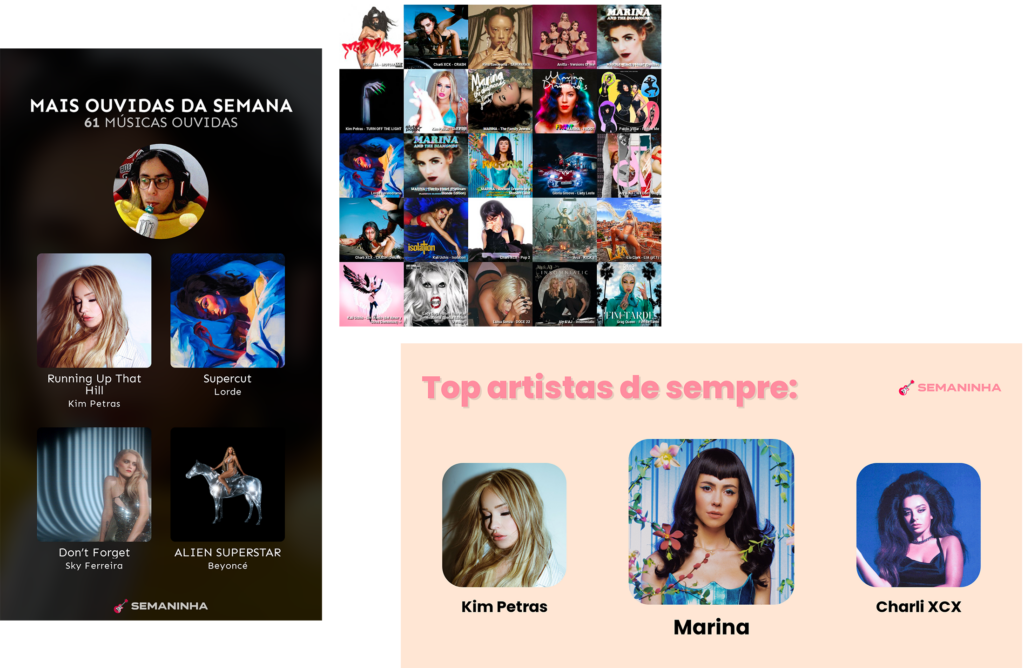
The entirety of this application is written with Svelte and SvelteKit — even the themes! When you click the “Generate” button, the app will fetch your listening history from Last.fm, get some images from Spotify, place it all in a Svelte template and save a screenshot of it using Puppeteer.
I have lots of plans for this project, including adding new themes, making it even easier to develop new ones, and adding integration with Spotify and Apple Music.
Welcome, Doce! It's great to have you as part of our development team. To learn more about Doce, visit his website doceazedo.com or follow him on Twitter @doceazedo911.
Comments