This article is brought to you by Datawrapper, a data visualization tool for creating charts, maps, and tables. Learn more.
We are pushing the planet over the edge
This is Simon, a software engineer at Datawrapper. For this week’s edition of the Weekly Chart, I took a closer look at data from a depressing study about the overconsumption of natural resources.
Another IPCC report was released last week, and once again we’ve been reminded that we are on the brink of an ecological collapse. The report is quite clear: Without immediate and radical change across all sectors of the global economy, the outcome will be catastrophic.
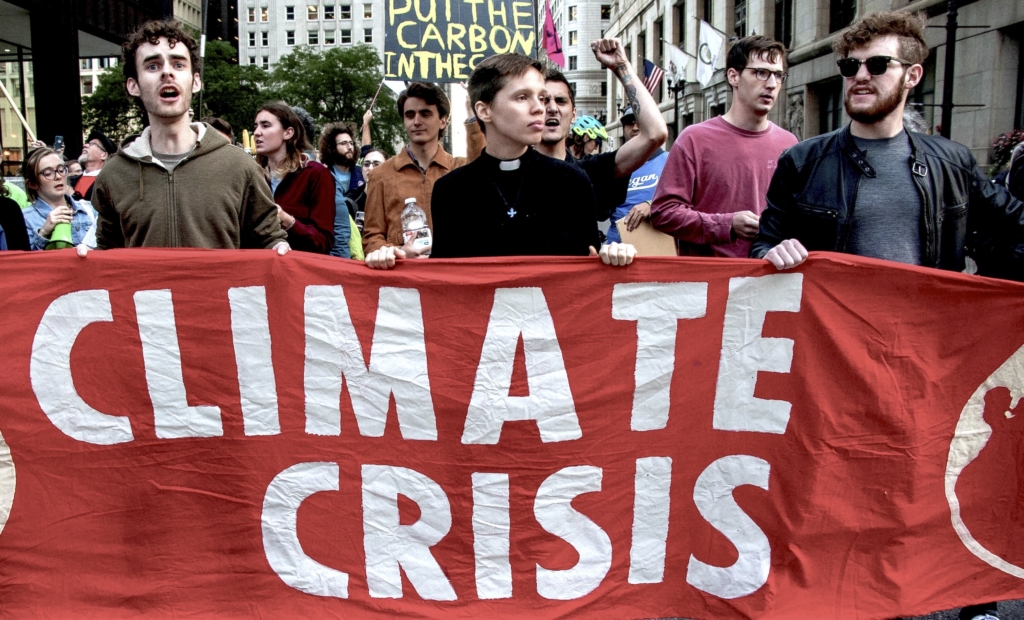
Despite the urgency of the report, the facts are not new. We have known for years that, to preserve our livelihoods, we must drastically reduce our consumption of fossil fuels and other natural resources. But we have failed to act. While people around the world keep protesting against burning even more fossil fuels, and many of us are trying to reduce our individual footprints, there is no evidence of a general change of course.
On the contrary: A recent study by researchers at the University of Leeds highlights how strongly the consumption of natural resources is still growing. The problem is not just fossil fuels. It is also the overuse of other materials, such as minerals or biomass, that negatively impact the environment, for example through chemical pollution, biodiversity loss, or land-use change. The global consumption of these resources has increased dramatically in the last 50 years and is now far beyond the limits of what is considered sustainable.
How much resource use is fair?
When comparing the countries in the chart above, we see that high-income countries, such as the U.S., the EU, and Japan, use a huge amount of natural resources. But for some years, resource consumption has also been increasing in middle-income countries, such as China and India. However, there are significantly more people in China and India than in high-income countries. China has 1.4 billion people, while the U.S. has only 330 million. To account for this, the authors of the study propose a fair share per country, which describes how many resources each nation can use without exceeding the planet’s natural limits. Resource consumption that exceeds the fair share is called resource overshoot.
If we also take into account that countries such as China have only very recently achieved a certain level of industrialization and prosperity, it becomes clear how unfair the distribution of resource consumption is between the the global North and the less prosperous countries of the global South. The U.S. alone is responsible for more than a quarter of the global overshoot of the past five decades, the European Union is responsible for another quarter. The 15% of the world's population that live in high-income countries are clearly the drivers of the ecological breakdown of our planet.
Where do we go from here?
The answer is both simple and complicated: The authors of the study stress that we need to urgently reduce our resource use to fair and sustainable levels, which will likely require high-income countries to adopt post-growth or degrowth approaches. That means no longer focusing on income and GDP growth as the primary indicator for progress, and instead finding ways to maintain or even increase social welfare and individual well-being while downscaling the consumption and production of goods. That may sound like a pretty radical idea, but it is actually in line with the latest IPCC report, which adopts many degrowth ideas even though it does not necessarily use the term.
But what can you do individually? On a personal level, here are a couple of very practical suggestions: Buy less stuff. Do not book that flight. Eat less meat and dairy products. If you can, get rid of your car. If you can’t, drive less and switch to electric. If you own a house, insulate, get solar panels, and replace that old oil furnace with a modern heat pump. But it is crucial to understand one thing: While your individual consumer choices are important, they will not take us all the way. The only way to mitigate the imminent ecological breakdown is a fast and radical change of economic policies, particularly in the rich countries of the global North.
About the data
The charts in this article are based on research by Jason Hickel, Daniel W O’Neill, Andrew L Fanning, and Huzaifa Zoomkawala, published as National Responsibility for Ecological Breakdown: A Fair-shares Assessment of Resource. The data was published by the University of Leeds, in a data portal aptly called A Good Life For All Within Planetary Boundaries. The country classification by income level follows the World Bank Country and Lending Groups.
As always, do let me know if you have feedback, suggestions, or questions. I am looking forward to hearing from you! You can get in touch with me via simon@datawrapper.de, Mastodon, or Twitter.


Comments